
Order a report
Custom-made industry research, company ratings, competitor analysis


Russia continues to diversify the economy
Contrary to common belief, the Russian economy is successfully wending the way of business activity diversification and forming not only by means of oil and gas.
Tax collection to the RF budget system by sectors conforms changes in the economy: following the results of 2017, volume of tax collected from non-materials sector amounted to 70,8%, and 29,2% were recorded for basic materials sector. Totally 17 194 bln RUB, or by 19,5% more than in 2016 with total taxes amount of 14 388 bln RUB, were transferred to the budgets at all levels in the past year.
Taxes and duties paid to the budget at all levels represent total GDP structure of the country (see Picture 1). It is fair to say that business connected with non-renewable resources mining is still on leading position. However, other sectors increase assignments: the share of taxes of manufacturing exceeded 19%, wholesale and retail trade — 10,7% of total payments. Being a new but increasing experience for our country, share of obligatory payments of financial and insurance, as well as scientific and technological activity is 5%, while the same business in the Occident forms over 50% of GDP.
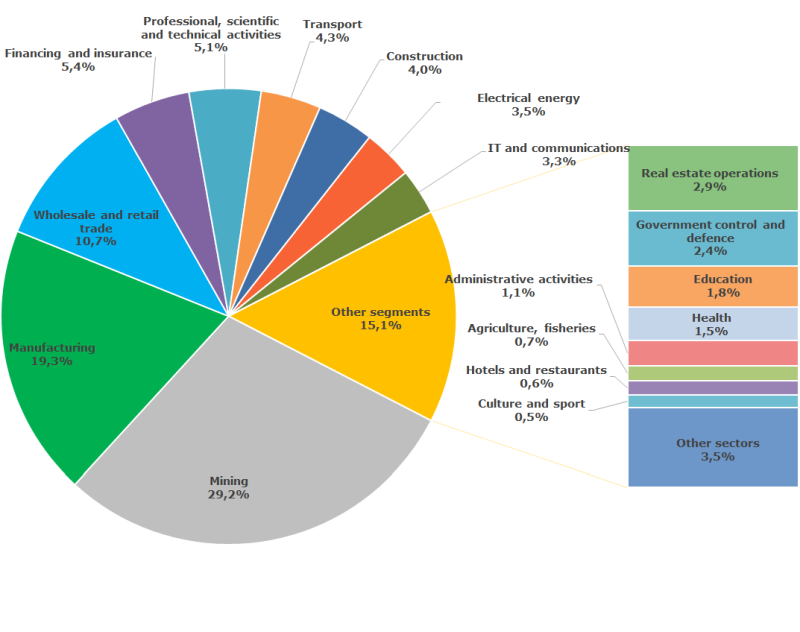 Picture 1. Structure of the Russian economy in terms of taxes and duties paid to the budget in 2017, % by major economic sectors
At the same time, in the domestic economy there are structural problems, being well observed regionally:
1. Over-concentration
Main business activity and financial flows are concentrated in few regions: over 61% of all taxes are collected in 10 federal subjects (see Table 1), that largely explains the firmly held views of success, migration attractiveness and stable level of social and economic development of these regions. The rest of 75 subjects accumulate less than 39% of obligatory levies and charges to the budgets.
Moscow accumulates 18% of all taxes to the RF budget system, where 20% accounts for trade, 19% for financing and insurance, 13% for professional, scientific and technical activities.
Khanty-Mansi Autonomous district — Yugra, where 86% of economy accounts for mining operations, is ranked number two with 13% of taxes paid.
Yamal-Nenets Autonomous district, another mineral region, closes the top three with 7% of taxes.
2. Imbalance of economic development
Imbalance economy downsides are shown by single-industry cities, located around one large enterprise. If the employing enterprise is successfully operating, lack or insufficient provision of the region with own made products and food could be barely noticeable. Increased product prices due to additional delivery costs are compensated with high wages. High prices and the absence of alternative jobs are resulted in instability and risk, if any financial difficulties occur at the enterprise.
Region with balanced economy is able to reallocate jobs, prevent out migration, provide with payments to budget under unfavorable conditions of one of the industries and restore balance then.
The current economic structure is reflected in specialty of regions, which can be divided into 4 groups:
- – Postindustrial Moscow with developed service sector, science and trade.
- – Subjects with one prevailing industry — mining of recoverable resources — such as Khanty-Mansi Autonomous district — Yugra, Yamal-Nenets Autonomous district, Nenets Autonomous district where basic materials sector accumulates over 85% of economy. This is exactly the case of resource-based economy alone, but this statement is incorrectly extrapolated nationwide.
- – Traditional industrial centers: Saint-Petersburg, Nizhniy Novgorod and Chelyabinsk regions leading by manufacturing.
- – Regions with mixed economy: Moscow and Samara regions, Krasnodar territory where other realms are alongside with the developed production sector.
| № | Region | Taxes and duties to the budget system of RF, bln RUB | Share of the region in total taxes and duties across RF, % | Specialization of the region, main sectors of receipts to the FR budget system | Share of the sector on total taxes and duties of the subject, % |
| 1 | Moscow | 3 060 | 18 | Wholesale and retail trade | 20 |
| Financing and insurance | 19 | ||||
| Professional, scientific and technical activities | 13 | ||||
| 2 | Khanty-Mansi Autonomous district — Yugra | 2 214 | 13 | Mining | 86 |
| Other sectors | 4 | ||||
| Transport | 2 | ||||
| 3 | Yamal-Nenets Autonomous district | 1 138 | 7 | Mining | 86 |
| Wholesale and retail trade | 7 | ||||
| Manufacturing | 2 | ||||
| 4 | Saint-Petersburg | 1 074 | 6 | Manufacturing | 44 |
| Wholesale and retail trade | 8 | ||||
| Professional, scientific and technical activities | 7 | ||||
| 5 | Moscow region | 830 | 5 | Manufacturing | 27 |
| Wholesale and retail trade | 23 | ||||
| Real estate operations | 8 | ||||
| 6 | Republic of Tatarstan | 557 | 3 | Mining | 53 |
| Manufacturing | 17 | ||||
| Wholesale and retail trade | 6 | ||||
| 7 | Krasnoyarsk territory | 472 | 3 | Mining | 48 |
| Manufacturing | 15 | ||||
| Electrical energy industry | 11 | ||||
| 8 | Samara region | 400 | 2 | Mining | 37 |
| Manufacturing | 31 | ||||
| Wholesale and retail trade | 6 | ||||
| 9 | Krasnodar territory | 338 | 2 | Wholesale and retail trade | 20 |
| Manufacturing | 19 | ||||
| Transport | 12 | ||||
| 10 | Republic of Bashkortostan | 336 | 2 | Mining | 51 |
| Manufacturing | 12 | ||||
| Wholesale and retail trade | 7 | ||||
| Total for Top-10 | 10 419 | 61 | |||
| Nationwide | 17 194 | 100 | |||
3. Disproportion of economic development
The volume of tax collection per capita indicates great disproportion of economic development among regions. National average amount of taxes and duties for 2017 comes out 117 RUB/person per annum. Maximum amount of 2 112 RUB/person was recorded in the Yamal-Nenets Autonomous district, and the minimum of 8 RUB/person — in the Republic of Ingushetia. The difference is 264 times.
| № | Region | Volume of tax receipts to the RF budget system per capita, RUB |
| 1 | Yamal-Nenets Autonomous district | 2 112 |
| 2 | Nenets Autonomous district | 1 657 |
| 3 | Khanty-Mansi Autonomous district – Yugra | 1 338 |
| 4 | Sakhalin region | 292 |
| 5 | Moscow | 245 |
| 6 | Chukotka Autonomous district | 236 |
| 7 | Republic of Komi | 212 |
| 8 | Saint-Petersburg | 201 |
| 9 | Leningrad region | 178 |
| 10 | Republic of Sakha (Yakutia) | 176 |
| 11 | Krasnoyarsk territory | 164 |
| 12 | Tomsk region | 159 |
| 12 | Tyumen region | 151 |
| 14 | Republic of Tatarstan | 143 |
| 15 | Irkutsk region | 133 |
| 16 | Orenburg region | 133 |
| 17 | Samara region | 125 |
| 18 | Perm territory | 122 |
| 19 | Astrakhan region | 113 |
| 20 | Kaliningrad region | 112 |
| 21 | Republic of Udmurtia | 111 |
| 22 | Yaroslavl region | 111 |
| 23 | Moscow region | 111 |
| 24 | Murmansk region | 104 |
| 25 | Kamchatka territory | 100 |
| 26 | Ryazan region | 99 |
| 27 | Khabarovsk territory | 93 |
| 28 | Magadan region | 93 |
| 29 | Omsk region | 91 |
| 30 | Republic of Bashkortostan | 83 |
| 31 | Kaluga region | 82 |
| 32 | Nizhniy Novgorod region | 79 |
| 33 | Sverdlovsk region | 72 |
| 34 | Saratov region | 68 |
| 35 | Volgograd region | 63 |
| 36 | Arkhangelsk region | 62 |
| 37 | Novosibirsk region | 62 |
| 38 | Krasnodar territory | 60 |
| 39 | Chelyabinsk region | 60 |
| 40 | Vologda region | 60 |
| 41 | Belgorod region | 59 |
| 42 | Kemerovo region | 57 |
| 43 | Primorye territory | 53 |
| 44 | Ulyanovsk region | 52 |
| 45 | Vladimir region | 51 |
| 46 | Kursk region | 51 |
| 47 | Republic of Mordovia | 50 |
| 48 | Tver region | 48 |
| 49 | Smolensk region | 48 |
| 50 | Rostov region | 47 |
| 51 | Novgorod region | 43 |
| 52 | Tula region | 42 |
| 53 | Republic of Karelia | 42 |
| 54 | Voronezh region | 42 |
| 55 | Republic of Khakassia | 42 |
| 56 | Kostroma region | 39 |
| 57 | Penza region | 38 |
| 58 | Lipetsk region | 38 |
| 59 | Republic of Mari El | 37 |
| 60 | Republic of Adygea | 37 |
| 61 | Jewish Autonomous Region | 37 |
| 62 | Republic of Crimea | 36 |
| 63 | Republic of Chuvashia | 35 |
| 64 | Kirov region | 35 |
| 65 | Stavropol territory | 35 |
| 66 | Bryansk region | 34 |
| 67 | Oryol region | 34 |
| 68 | Altai territory | 34 |
| 69 | Kurgan region | 33 |
| 70 | Sevastopol | 33 |
| 71 | Zabaikalye territory | 32 |
| 72 | Pskov region | 30 |
| 73 | Republic of Altai | 30 |
| 74 | Republic of Kalmykia | 29 |
| 75 | Amur region | 29 |
| 76 | Ivanovo region | 28 |
| 77 | Tambov region | 28 |
| 78 | Republic of Buryatia | 28 |
| 79 | Republic of North Ossetia — Alania | 25 |
| 80 | Karachay-Cherkess Republic | 20 |
| 81 | Republic of Tyva | 19 |
| 82 | Kabardino-Balkar Republic | 15 |
| 83 | Republic of Dagestan | 11 |
| 84 | Chechen Republic | 9 |
| 85 | Republic of Ingushetia | 8 |
| Russian Federation | 117 | |
Regional economies development factor could be a transition from fiscal equalization, support of subsidized territories by means of federal transfers to promotional strategy based on investment raising, creation of favorable business climate, as well as on transferring a part of taxes from the federal center to the budgets of subjects and municipalities.
Guided by the existing tendency, further increase in share of non-materialssectors is expected. Despite of stabilization of the world oil market conditions, Russia will be under sanction pressure from Europe and the USA in themid-run: ban on purchasing thehi-techequipment for oil and gas extraction for instance. Moreover, devaluation of rouble and implementing import substitution programs stimulate the establishment of companies with high value added.