
Order a report
Custom-made industry research, company ratings, competitor analysis


Trends in activity of the largest companies of the real economy sector of Krasnodar region
Information Agency Credinform has prepared the review of trends in activity of the largest companies of the real economy sector of Krasnodar region.
The largest enterprises (TOP-10 and TOP-1000) in terms of annual revenue were selected according to the data from the Statistical Register for the latest available periods (2014 – 2016). The analysis was based on data of the Information and Analytical system Globas.
Net assets
Indicator of real cost of corporate assets, which is annually calculated as the difference between assets of the company and its debt liabilities. If the company’s debts exceed net worth value, net assets indicator is considered negative (insufficiency of property).
| Position in ТОP-1000 | Name, activity | Net asset value, bln RUB* | Solvency index Globas | ||
| 2014 | 2015 | 2016 | |||
| 1 | 2 | 3 | 4 | 5 | 6 |
| 1. | NAO CHERNOMORSKIE MAGISTRALNYE NEFTEPROVODY Oil and oil products transportation via pipelines |
88,0 | 98,2 | 125,5 | 145 Superior |
| 2. | NAO TANDER Retail trade |
58,2 | 69,1 | 82,1 | 195 High |
| 3. | NAO CASPIAN PIPELINE CONSORTIUM-R Oil transportation via pipelines |
-13,8 | -32,1 | 37,7 | 227 Strong |
| 4. | PAO KUBAN POWER AND ELECTRIFICATION Transmission of electricity and technological connection to power distribution networks |
29,7 | 32,4 | 35,5 | 171 Superior |
| 5. | NAO FIRMA AGROKOMPLEKS IM. N.I.TKACHEVA Mixed farming |
22,6 | 27,6 | 29,7 | 199 High |
| 996. | NAO KRASNAYA POLYANA Hotels and similar accommodation |
16,7 | 1,3 | -4,2 | 287 Medium |
| 997. | NAO TEMPL INС Renting and operating of own or leased untenanted real estate Process of being wound up, 26.04.2017 |
-4,2 | -6,5 | -5,8 | 600 Insufficient |
| 998. | LLC InvestGroup-Hotel Hotels and similar accommodation |
-4,8 | -5,6 | -6,3 | 321 Adequate |
| 999. | LLC University Plaza Real estate management on a fee or contract basis |
-3,4 | -5,7 | -7,4 | 323 Adequate |
| 1000. | LLC YUG-NOVYI VEK Investment in authorized capital, venture capital investment |
-6,7 | -12,3 | -15,5 | 359 Adequate |
*) – growth/decline indicators in comparison with prior period are marked green and red in columns 4 and 5 respectively.
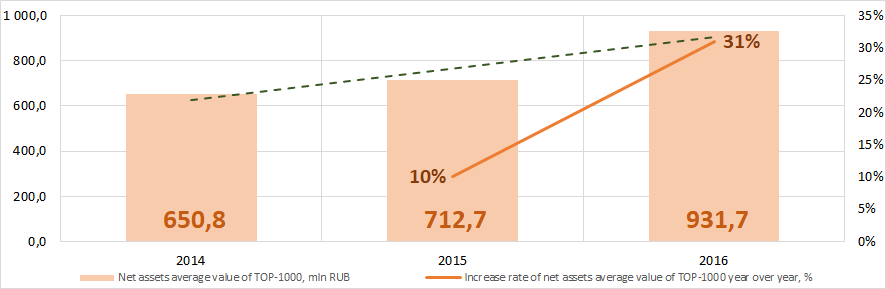 Picture 1. Change in average net assets value of the largest companies of the real economy sector of Krasnodar region in 2014 – 2016
Sales revenue
In 2016 total revenue of 10 largest companies amounted to 45% from TOP-1000 total revenue (Picture 2).
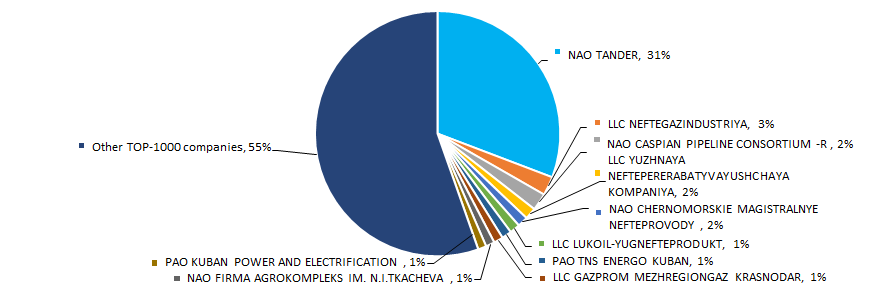 Picture 2. Shares of TOP-10 companies in TOP-1000 total revenue for 2016
The increase in sales revenue is observed (Picture 3).
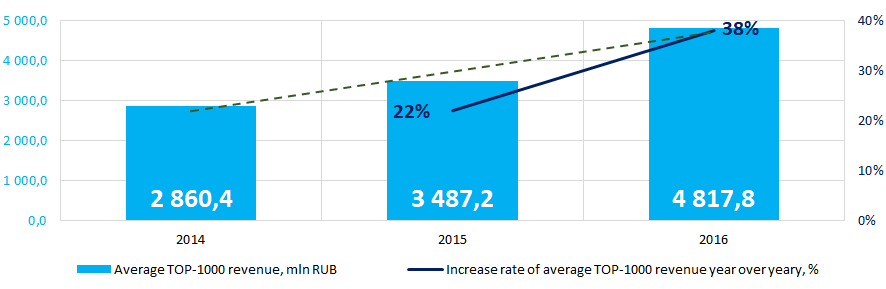 Picture 3. Change in average revenue of the largest companies of the real economy sector of Krasnodar region in 2014 – 2016
Profit and loss
In 2016, profit of 10 largest companies amounted to 60% from TOP-1000 total profit (Picture 4).
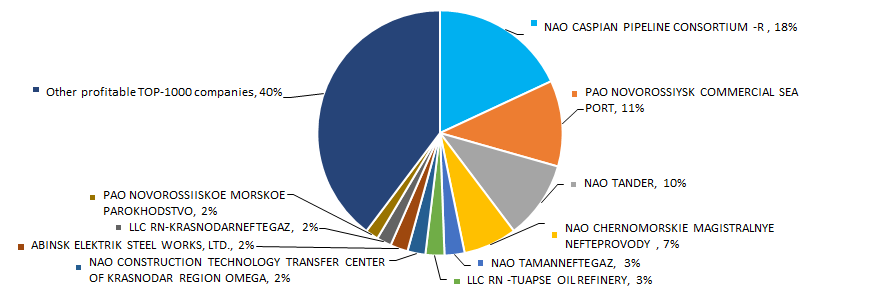 Picture 4. Shares of TOP-10 companies in TOP-1000 total profit for 2016
For the three-year period, the average revenue values of TOP-1000 companies show the growing tendency and the average net loss decreases (Picture 5).
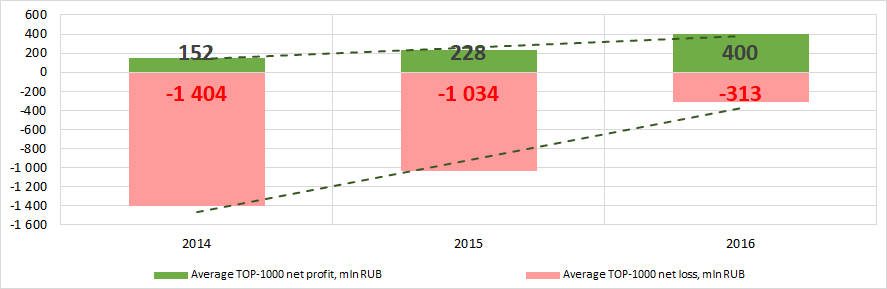 Picture 5. Change in average profit/loss of the largest companies of the real economy sector of Krasnodar region in 2014 – 2016
Main financial ratios
For – 2016 period the average values of current liquidity ratio of TOP-1000 were higher than recommended values – from 1,0 to 2,0 with the growing tendency (Picture 6).
Current liquidity ratio (ratio of total working capital to short-term liabilities) shows the sufficiency of company’s assets to meet short-term obligations.
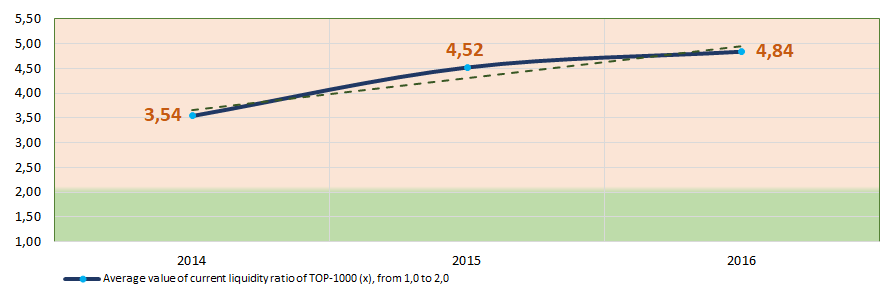 Picture 6. Change in average values of current liquidity ratio of the largest companies of the real economy sector of Krasnodar region in 2014 – 2016
For the three-year period, the increasing tendency of ROI ratio is observed (Picture 7). The ROI ratio is calculated as a ratio of net profit to sum of stockholder equity and long-term liabilities and shows the return from equity involved in commercial activities and long-term borrowed funds.
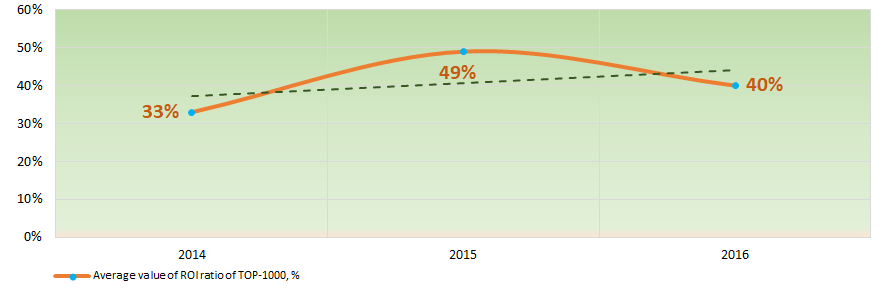 Picture 7. Change in average values of ROI ratio of the largest companies of the real economy sector of Krasnodar region in 2014 – 2016
Assets turnover ratio is the ratio of sales revenue and company’s average total assets for a period. It characterizes the effectiveness of using of all available resources, regardless the source of their attraction. The ratio shows how many times per year the full cycle of production and circulation is performed, generating the corresponding effect in the form of profit.
For the three-year period, this business activity ratio demonstrated the downward trend (Picture 8).
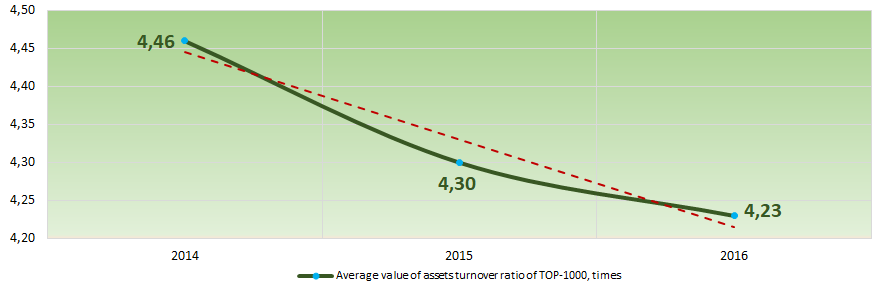 Picture 8. Change in average values of assets turnover ratio of the largest companies of the real economy sector of Krasnodar region in 2014 – 2016
Production and services structure
The largest share in TOP-1000 total revenue take companies engaged in trade and production of petroleum products (Picture 9).
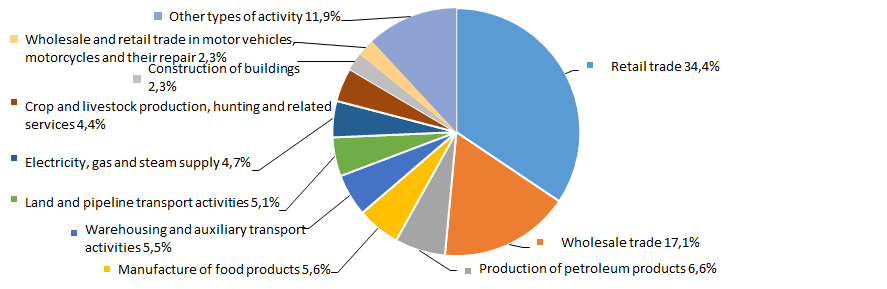 Picture 9. Distribution of activities in TOP-1000 total revenue, %
48% of TOP-1000 companies are registered in the Register of Small and Medium-Sized Business Entities of Federal Tax Service of the Russian Federation, among them 25% have status of medium-sized enterprises, 23% are classified as small enterprises.
Financial position score
The assessment of company’s financial position shows that more than a half of companies have stable or above average financial position (Picture 10).
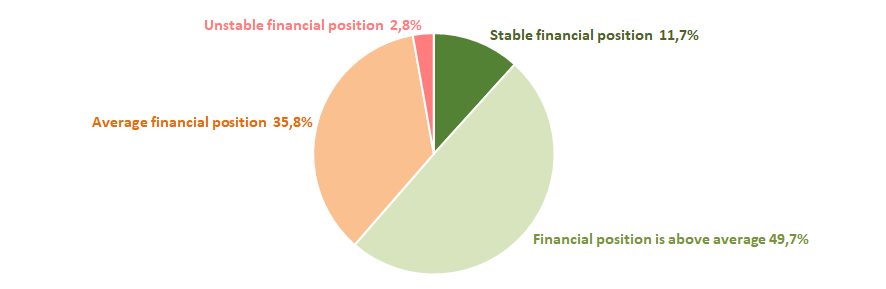 Picture 10. Distribution of TOP-1000 companies by financial position score
Solvency index Globas
The majority of TOP-1000 companies have superior/high or strong/medium solvency index Globas, this fact shows the ability of the companies to meet their obligations in time and fully (Picture 11).
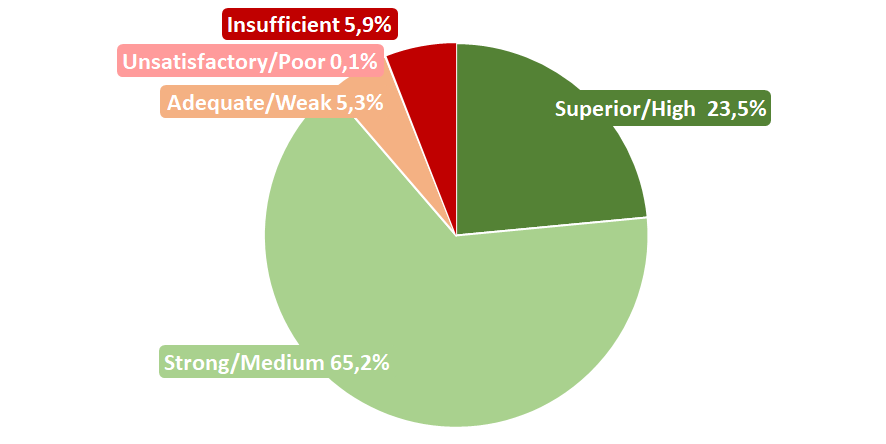 Picture 11. Distribution of TOP-1000 companies by solvency index Globas
Hereby, the complex assessment of the largest real economy companies of Krasnodar region, taking into account main indexes, financial ratios and indicators, demonstrates the denomination of favorable trends.