Auditors are obliged to notify the Federal Service for Financial Monitoring about shady deals and financial transactions
The Federal Law from April 23, 2018 № 112-FL «On countering the legalization (laundering) of criminally obtained incomes and the financing of terrorism» and the Article 13 of the Federal Law «On auditing» were amended. According to them, auditing firms and private auditors are obliged to inform the Federal Service for Financial Monitoring (hereinafter Rosfinmonitoring) about any deals and financials transactions of their clients which were or could be aimed at legalization of criminally obtained incomes or financing of terrorism.
The procedure of reporting about such kind of deals or financial transactions is determined by the Government of Russia. Auditor may not disclose information about the fact of data reporting.
Amendments also establish that Rosfinmonitoring determines and coordinates with other regulatory authorities the form of data provided and the procedure of data provisioning through user accounts of regulatory authorities. The Law also defines user account and its purposes.
For reference
The Information and Analytical System Globas contains information about over 15,5 thousand organizations in Russia carrying out fiscal audit as registered principal activity. The subscription on the System opens possibility to get acquainted with their activities.
Amount of members of self-regulatory organization of auditors decreases (Picture 1).
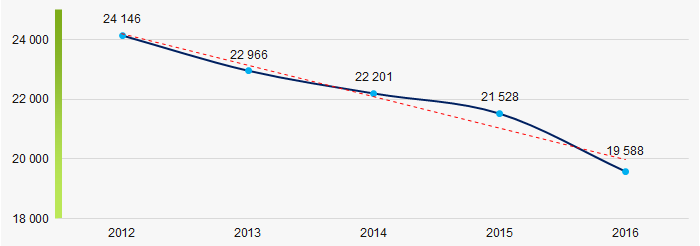 Picture 1. Amount of members of self-regulatory organization of auditors in 2012 — 2016 (men). Source — Ministry of Finance of RF, as of 31.05.2017
The number of given audit reports on obligatory audit also decreases (Picture 2).
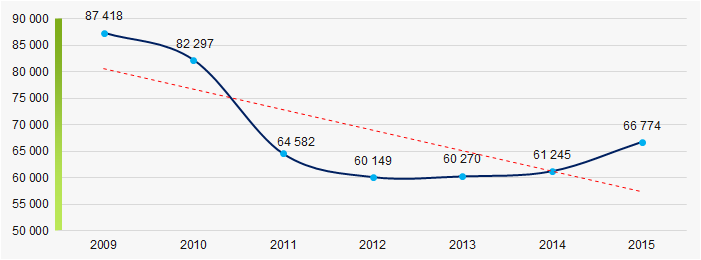 Picture 2. Number of given audit reports on obligatory audit in 2009 — 2015 (units). Source — Ministry of Finance of RF, as of 19.09.2017
Activity trends of Russian largest producers and suppliers of coffee, tea, cocoa and spices
Information Agency Credinform presents a review of activity trends of Russian largest producers and suppliers of coffee, tea, cocoa and spices.
The producers and wholesale suppliers of coffee, tea, cocoa and spices with the highest volume of annual revenue (TOP-10 and TOP-1000) have been selected for the ranking, according to the data from the Statistical Register for the latest available accounting periods (2014 — 2016). The analysis was based on the data from the Information and Analytical system Globas.
Net assets is an indicator of fair value of corporate assets that is calculated annually as assets on balance less company’s liabilities. Net assets value is negative (insufficiency of property) if liabilities are larger than the property value.
| No. in TOP-1000 | Name, INN, region, key type of activity | Net assets, million RUB | Solvency index Globas | ||
| 2014 | 2015 | 2016 | |||
| 1. | UNILEVER RUS LLC INN 7705183476 Moscow Production of tea and coffee |
14 093 |  8 188 8 188 |
 11 388 11 388 |
260 Medium |
| 2. | ORIMI TRADE LLC INN 7804069580 Leningrad region Wholesale of coffee, tea, cocoa and spices |
5 282 |  10 207 10 207 |
 7 810 7 810 |
217 Strong |
| 3. | ORIMI LLC INN 4703044256 Leningrad region Production of tea and coffee |
3 733 |  4 896 4 896 |
 6 349 6 349 |
180 High |
| 4. | NESTLE KUBAN LLC INN 2353018969 Krasnodar territory Production of tea and coffee |
-783 |  2 237 2 237 |
 3 937 3 937 |
244 Strong |
| 5. | COMPANY PROXIMA NJSC INN 5405143630 Novosibirsk region Production of spices |
2 873 |  3 540 3 540 |
 3 907 3 907 |
168 Superior |
| 996. | BM-GROUP LLC INN 5047155440 Moscow region Wholesale of coffee, tea, cocoa and spices |
-6 |  -70 -70 |
 -203 -203 |
364 Adequate |
| 997. | SANTI LLC INN 7702371288 Moscow Production of tea and coffee |
154 |  -95 -95 |
 -459 -459 |
336 Adequate |
| 998. | RYAZAN TEA FACTORY LLC INN 6228050257 Ryazan region Production of tea and coffee Process of being wound up, 23.09.2016 |
39 |  -47 -47 |
 -615 -615 |
600 Insufficient |
| 999. | BETA GIDA LLC INN 5053023219 Moscow region Production of tea and coffee |
-119 |  -1 039 -1 039 |
 -744 -744 |
279 Medium |
| 1000. | TEA CENTURY LLC INN 7722159219 Moscow region Wholesale of coffee, tea, cocoa and spices In process of reorganization by spin-off simultaneously with the accession, 29.05.2018 |
-474 |  -793 -793 |
 -948 -948 |
321 Adequate |
 — growth compared to prior period,
  — decline compared to prior period.
Average industry values of net assets tend to increase within the decade (Picture 1).
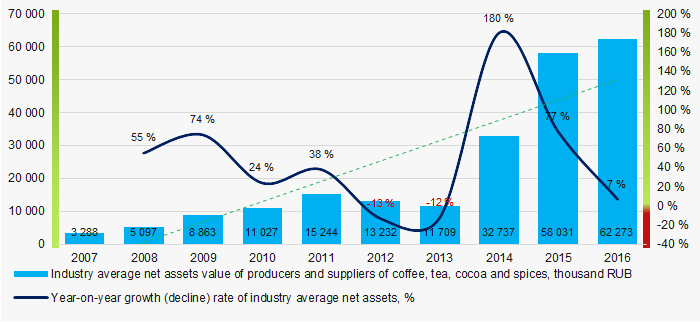 Picture 1. Change in average net asset value of producers and suppliers of coffee, tea, cocoa and spices in 2007 — 2016
Sales revenue
In 2016 sales revenue of 10 industry leaders amounted to 58% of total revenue of TOP-1000 companies. This is an indicator of a high level of business concentration (Picture 2).
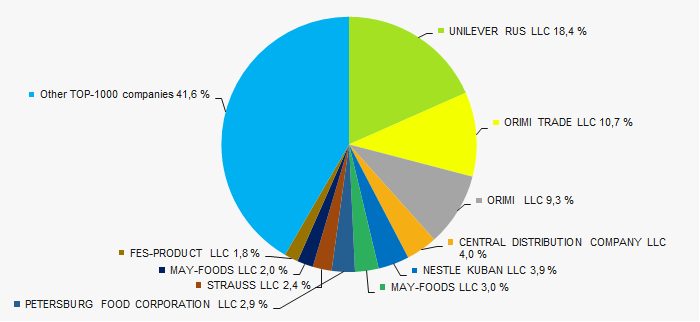 Picture 2. TOP-10 companies by their share in 2016 total revenue of TOP-1000 companies
In general, revenue tends to increase (Picture 3).
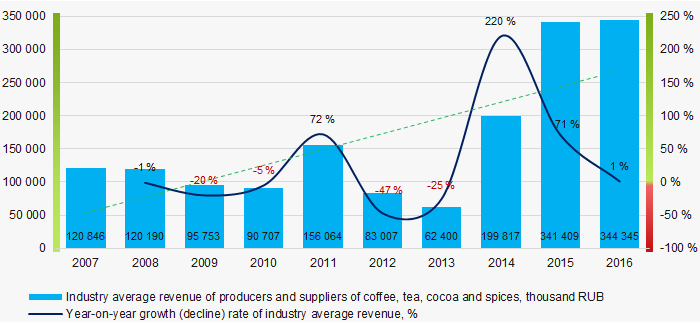 Picture 3. Change in average revenue of producers and suppliers of coffee, tea, cocoa and spices in 2007— 2016
Profit and loss
In 2016 profit of 10 industry leaders amounted to 67% of total profit of TOP-1000 companies (Picture 4).
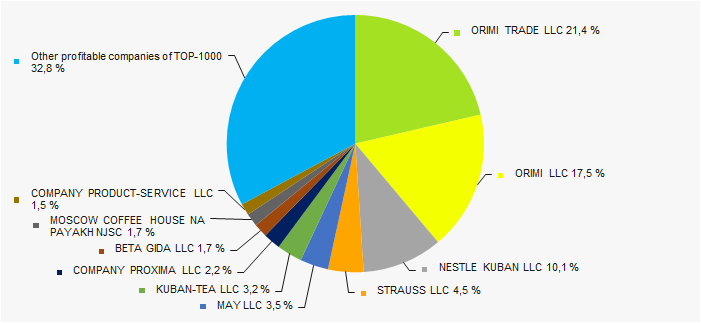 Picture 4. TOP-10 companies by their share in 2016 total profit of TOP-1000 companies
Average net profit values of companies of the sector within a decade tend to increase, despite the losses of 2015 (Picture 5).
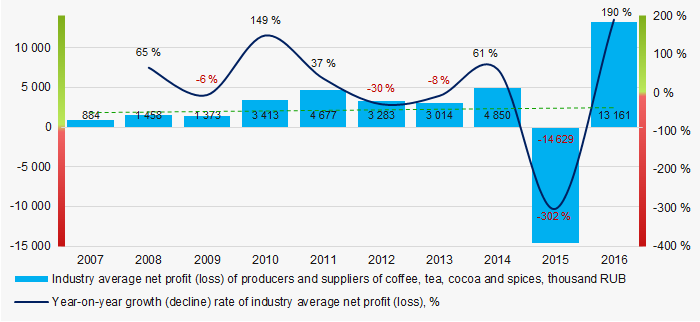 Picture 5. Change in average net profit of the largest producers and suppliers of coffee, tea, cocoa and spices in 2007 — 2016
Average net profit values of TOP-1000 companies for 3 years tend to increase, and average loss value declines (Picture 6).
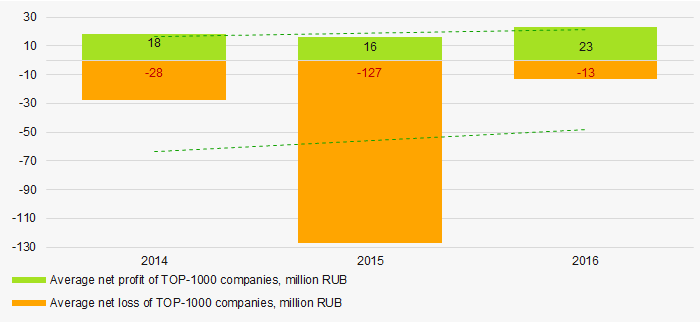 Picture 6. Change in average profit and loss of TOP-1000 producers and suppliers of coffee, tea, cocoa and spices in 2014 — 2016
Key financial ratios
Total liquidity ratio (a ratio of current assets to current liabilities) reveals the sufficiency of a company’s funds for meeting its short-term liabilities.
During the last decade industry average values of total liquidity ratio were within the recommended value — from 1,0 to 2,0 (Picture 7). In general, the ratio value tends to increase.
A calculation of practical values of financial ratios, which might be considered as normal for a certain industry, has been developed and implemented in the Information and Analytical system Globas by the experts of the Information Agency Credinform, having taken into account the current situation in the economy as a whole and in the industries.
Average practical value of total liquidity ratio of producers and suppliers of coffee, tea, cocoa and spices amounted from 0,78 to 2,31.
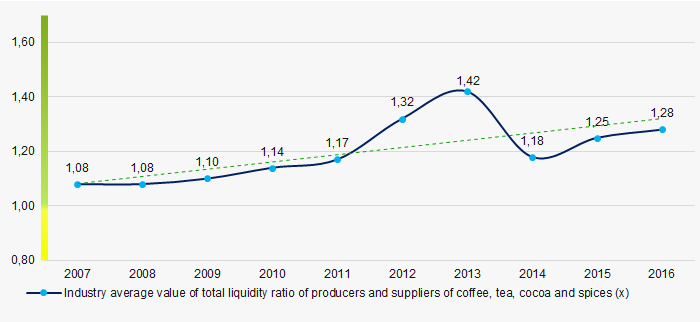 Picture 7. Change in average values of total liquidity ratio of producers and suppliers of coffee, tea, cocoa and spices in 2007 — 2016
The return on investment ratio is a ratio of net profit to total equity and noncurrent liabilities, and it demonstrates benefit from equity engaged in business activity and long-term raised funds of the company.
The return on investment ratio (Picture 8) tended to decrease during the decade.
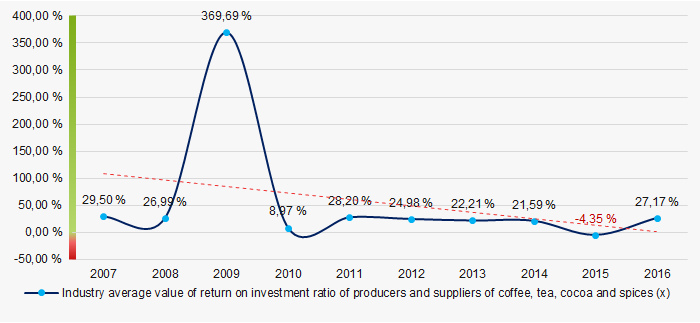 Picture 8. Change in industry average values of return on investment ratio of producers and suppliers of coffee, tea, cocoa and spices in 2007 — 2016
Assets turnover ratio is a ratio of sales revenue to average total assets for the period, and it measures resource efficiency regardless of the sources. The ratio indicates the number of profit-bearing complete production and distribution cycles per annum.
During the decade, this activity ratio tended to decrease (Picture 9).
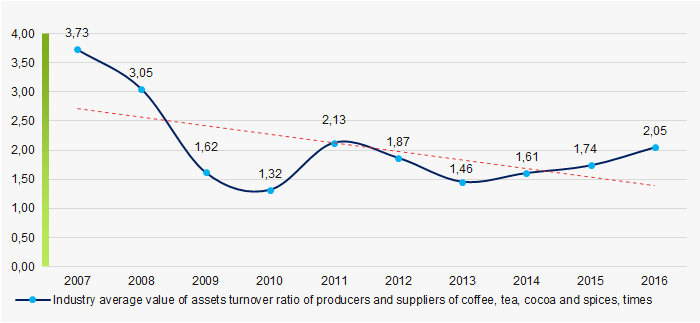 Picture 9. Change in industry average values of assets turnover ratio of producers and suppliers of coffee, tea, cocoa and spices in 2007 — 2016
Structure of production and supplies
Wholesalers of coffee, tea, cocoa and spices have the largest share in total revenue of TOP-1000 companies (Picture 10).
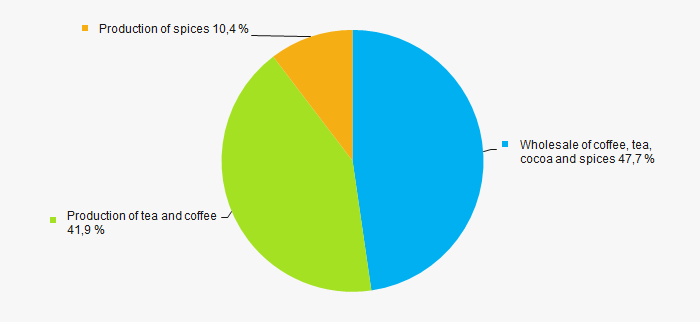 Picture 10. Types of activity by their share in total revenue of TOP-1000 companies, %
91% companies of TOP-1000 are included in the register of small and medium-sized businesses of the Federal Tax Service of the Russian Federation (Picture 11).
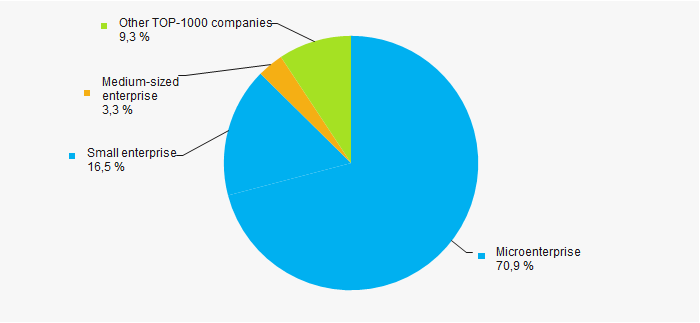 Picture 11. Shares of small and medium-sized enterprises in TOP-1000 companies of the sector, %
Key regions of activity
TOP-1000 companies are unevenly located throughout Russian territory, and are registered in 67 regions (Picture 12).
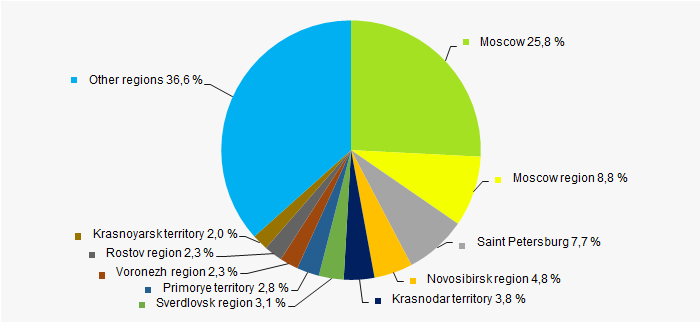 Picture 12. TOP-1000 companies by Russian regions
Financial position score
Assessment of financial state of TOP-1000 companies indicates that most of the companies have a stable and above average financial standing (Picture 13).
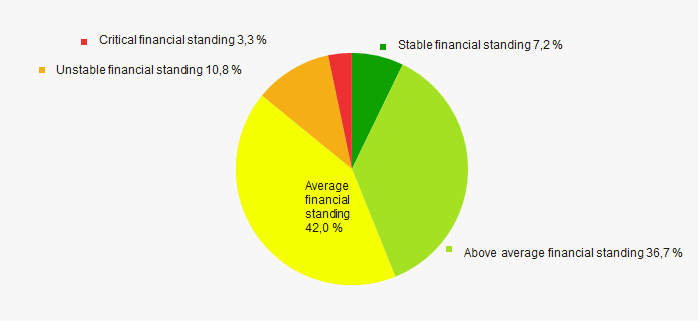 Picture 13. TOP-1000 companies by their financial position score
Solvency index Globas
Most of TOP-1000 companies have got a superior, high, strong and medium Solvency index Globas, that indicates their capability to meet liabilities timely and in full (Picture 14).
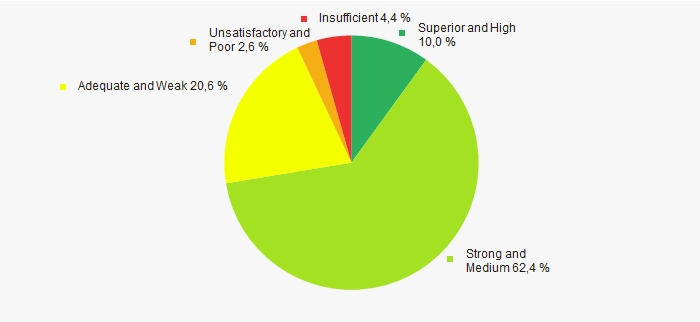 Picture 14. TOP-1000 companies by Solvency index Globas
Conclusion
A comprehensive assessment of the largest producers and suppliers of coffee, tea, cocoa and spices during the last decade, that considers key indexes, financial figures and ratios, is indicative of predominance of positive trends within the sector. Decrease of return on investment ratio and business activity ratio is an alarming factor.