
Order a report
Custom-made industry research, company ratings, competitor analysis


TOP regions of Russia by economic opportunities
Regional budgets for 2020 and the planning period 2021-2022 were adopted in all the subjects of the Russian Federation. The budget of each region consists of incomes and expenditures. The income budget is formed by taxes, as well as inter-budget transfers. The expenditure budget consists of revenues and sources of financing the deficit when expenses exceed revenues.
The expenditure side of the budget is of particular interest, since the amount of financing of transport infrastructure, social security, education, healthcare, etc. depends on its volume.
The economic opportunities of each region are different. Commodity regions and capitals have better position. Moscow leads among all the territories of Russia in terms of funding: the budget expenditures in 2020 will be a record 3,150 billion RUB, having increased by 15% in comparison with the 2019 budget (see Table 1).
Large amounts of funding bring results. Moscow is noticeably transforming: transport, the urban environment, and road infrastructure are booming. The main source of financial well-being of the capital is taxes: 41% of the total income is generated by personal income tax (PIT), and another 35% comes from corporate income tax.
Saint Petersburg is the second by budget expenditure. In 2020, it is planned to spend 728 billion RUB, which is by 9% more than in 2019.
The Jewish Autonomous Region has the lowest expenditure budget among 85 subjects: 11,8 billion RUB, which is 267 times less than in Moscow.
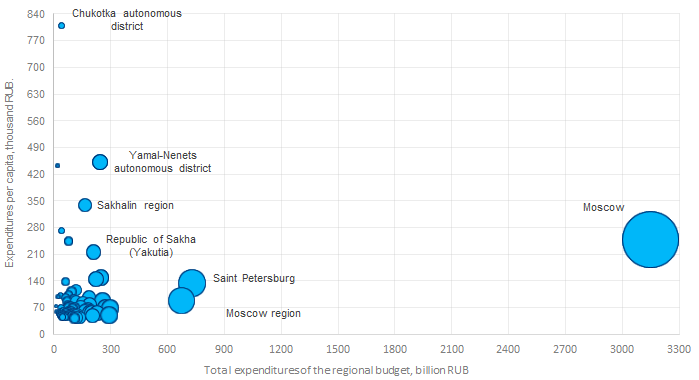 Picture 1. Total amount of expenditures of regional budgets for 2020, and budget expenditures per capita. The size of the circle corresponds to the value of the expenditure budget
Saint Petersburg’s budget is 4,3 times lower than the Moscow’s one. Based on a different population size, it is more correct to compare the economic opportunities of each region by dividing the expenditure budget by the number of inhabitants: budget expenditures per capita in Moscow in 2020 will amount to 250 thousand RUB per capita, and it will amount to 135 thousand RUB per capita in Saint Petersburg. Thus, it will be spent 1,9 times more per capita in Moscow than in St. Petersburg.
In Chukotka autonomous district, budget expenditures per capita increased to 810 thousand rubles, which is the countrywide maximum. The minimum indicator of 44 thousand RUB is recorded in Volgograd region, and it is 18 times less than that of the leader.
The numbers show that the problem of regional inequality persists. At the same time, with the exception of several leading regions, most of the territories have comparable economic opportunities. This is shown in the Table 1: budget expenditures is recorded up to 300 billion RUB for almost all subjects of Russia, and the volume of budget expenditures per capita is up to 140 thousand RUB.
| Rank | Subject of Russia | Budget expenditures, billion RUB | Per capita, thousand RUB |
| 1 | Moscow | 3150,0 | 250 |
| 2 | Saint Petersburg | 727,7 | 135 |
| 3 | Moscow region | 673,3 | 89 |
| 4 | Sverdlovsk region | 296,6 | 69 |
| 5 | Krasnodar territory | 292,8 | 52 |
| 6 | Republic of Tatarstan | 273,2 | 70 |
| 7 | Krasnoyarsk territory | 254,6 | 89 |
| 8 | Khanty-Mansi autonomous district-Yugra | 249,0 | 150 |
| 9 | Yamal-Nenets autonomous district | 244,5 | 452 |
| 10 | Republic of Bashkortostan | 226,6 | 56 |
| 11 | Tyumen region | 221,6 | 146 |
| 12 | Republic of Sakha (Yakutia) | 208,4 | 216 |
| 13 | Rostov region | 204,1 | 49 |
| 14 | Chelyabinsk region | 200,8 | 58 |
| 15 | Nizhniy Novgorod region | 194,6 | 61 |
| 16 | Irkutsk region | 188,9 | 79 |
| 17 | Republic of Crimea | 185,2 | 97 |
| 18 | Samara region | 184,8 | 58 |
| 19 | Novosibirsk region | 181,7 | 65 |
| 20 | Kemerovo region - Kuzbass | 171,3 | 64 |
| 21 | Sakhalin region | 166,3 | 340 |
| 22 | Perm territory | 163,5 | 63 |
| 23 | Leningrad region | 154,1 | 83 |
| 24 | Primorye territory | 141,6 | 74 |
| 25 | Republic of Dagestan | 138,6 | 45 |
| 26 | Voronezh region | 124,2 | 53 |
| 27 | Stavropol territory | 123,8 | 44 |
| 28 | Altai territory | 118,1 | 51 |
| 29 | Kaliningrad region | 116,5 | 116 |
| 30 | Khabarovsk territory | 115,4 | 87 |
| 31 | Saratov region | 111,4 | 46 |
| 32 | Volgograd region | 108,7 | 43 |
| 33 | Belgorod region | 107,9 | 70 |
| 34 | Orenburg region | 106,2 | 54 |
| 35 | Arkhangelsk region | 101,5 | 92 |
| 36 | Chechen Republic | 99,0 | 68 |
| 37 | Republic of Komi | 93,4 | 113 |
| 38 | Omsk region | 92,7 | 48 |
| 39 | Tula region | 90,5 | 61 |
| 40 | Vologda region | 86,8 | 74 |
| 41 | Tomsk region | 81,0 | 75 |
| 42 | Yaroslavl region | 77,9 | 62 |
| 43 | Republic of Udmurtia | 77,6 | 52 |
| 44 | Kamchatka territory | 77,0 | 245 |
| 45 | Murmansk region | 77,0 | 103 |
| 46 | Zabaikalye territory | 76,3 | 72 |
| 47 | Republic of Buryatia | 76,1 | 77 |
| 48 | Tver region | 75,8 | 60 |
| 49 | Kaluga region | 72,3 | 72 |
| 50 | Amur region | 69,4 | 88 |
| 51 | Lipetsk region | 69,2 | 60 |
| 52 | Vladimir region | 68,1 | 50 |
| 53 | Bryansk region | 67,6 | 56 |
| 54 | Kursk region | 63,9 | 58 |
| 55 | Ryazan region | 62,7 | 56 |
| 56 | Penza region | 62,4 | 47 |
| 57 | Sevastopol | 61,7 | 139 |
| 58 | Ulyanovsk region | 61,3 | 50 |
| 59 | Kirov region | 60,4 | 48 |
| 60 | Republic of Karelia | 60,3 | 98 |
| 61 | Republic of Chuvashia | 55,4 | 45 |
| 62 | Smolensk region | 50,9 | 54 |
| 63 | Astrakhan region | 50,8 | 50 |
| 64 | Kurgan region | 50,2 | 60 |
| 65 | Tambov region | 50,1 | 49 |
| 66 | Ivanovo region | 45,3 | 45 |
| 67 | Republic of Mordovia | 40,8 | 51 |
| 68 | Chukotka autonomous district | 40,3 | 881 |
| 69 | Republic of Kabardino-Balkaria | 39,4 | 45 |
| 70 | Magadan region | 38,6 | 273 |
| 71 | Pskov region | 38,3 | 61 |
| 72 | Republic of Khakassia | 37,7 | 70 |
| 73 | Novgorod region | 36,6 | 61 |
| 74 | Oryol region | 36,3 | 49 |
| 75 | Republic of Mari El | 35,4 | 52 |
| 76 | Kostroma region | 34,8 | 55 |
| 77 | Republic of North Ossetia-Alania | 34,0 | 49 |
| 78 | Republic of Tyva | 33,3 | 103 |
| 79 | Republic of Ingushetia | 28,6 | 57 |
| 80 | Republic of Karachay-Cherkessia | 26,2 | 56 |
| 81 | Republic of Adygea | 25,6 | 56 |
| 82 | Republic of Altai | 21,7 | 99 |
| 83 | Nenets autonomous district | 19,4 | 443 |
| 84 | Republic of Kalmykia | 16,3 | 60 |
| 85 | Jewish autonomous district | 11,8 | 74 |