
Order a report
Custom-made industry research, company ratings, competitor analysis


Asset turnover of the largest Russian stone quarrying companies
Information agency Credinform has prepared a ranking of the largest Russian stone quarrying companies. The companies with the largest volume of annual revenue (TOP-10) have been selected for the ranking, according to the data from the Statistical Register for the latest available accounting periods (2016 and 2015). Then they have been ranked by asset turnover ratio (Table 1). The analysis was based on the data from the Information and Analytical system Globas.
Asset turnover is a ratio of sales revenue to average total assets for the period. It is one of the activity ratios and it indicates resource efficiency regardless of source. This ratio shows the number of profit-bearing complete production and distribution cycles per annum.
A calculation of practical values of financial ratios, which might be considered as normal for a certain industry, has been developed and implemented in the Information and Analytical system Globas by the experts of the Information Agency Credinform, having taken into account the current situation in the economy as a whole and in the industries. The practical value of asset turnover ratio for stone quarrying companies amounted from 0.7 in 2016.
The whole set of financial indicators and ratios of a company is to be considered to get the fullest and fairest opinion about the company’s financial standing.
| Name, INN, region | Net profit, mln RUB | Revenue, mln RUB | Asset turnover, times | Solvency index Globas | |||
| 2015 | 2016 | 2015 | 2016 | 2015 | 2016 | ||
| 1 | 2 | 3 | 4 | 5 | 6 | 7 | 8 |
| Kamennogorsk Integrated Plant of Non-metallic Materials NJSC INN 4704006013 Leningrad region |
-7,79 | -8,97 | 666,75 | 763,19 | 2,84 | 3,49 | 310 Adequate |
| Orsk Quarry Administration PJSC INN 5615002820 Orenburg region |
16,16 | 97,44 | 1 145,59 | 2 057,88 | 1,41 | 2,77 | 169 Superior |
| Prionezhe Mining Company LLC INN 1020009123 Republic of Karelia |
-57,37 | 26,34 | 1 208,83 | 1 440,36 | 1,23 | 1,79 | 283 Medium |
| SpecTechProject LLC INN 7430020322 Chelyabinsk region |
2,94 | 8,11 | 611,97 | 836,30 | 1,21 | 1,72 | 277 Medium |
| Korfovsky Stone Quarry PJSC INN 2720002950 Khabarovsk Territory |
76,45 | 5,74 | 963,55 | 983,22 | 1,23 | 1,27 | 229 Strong |
| KARELPRODRESURS LLC INN 1001138331 Republic of Karelia |
0,20 | 8,02 | 1 356,89 | 1 709,17 | 0,62 | 0,84 | 264 Medium |
| First Non-Metallic Company PJSC INN 7708670326 Moscow |
35,97 | 45,20 | 3 905,91 | 5 606,33 | 0,56 | 0,79 | 233 Strong |
| Sunsky Quarry LLC INN 1003008176 Republic of Karelia |
0,18 | 11,81 | 712,98 | 905,09 | 0,63 | 0,78 | 265 Medium |
| Pavlovsk Nerud NJSC INN 3620013598 Voronezh region |
804,23 | 1 152,42 | 3 565,87 | 3 813,51 | 0,58 | 0,68 | 226 Strong |
| PNK-Ural LLC INN 7417018878 Chelyabinsk region |
-78,79 | -93,92 | 2 931,12 | 3 148,45 | 0,46 | 0,49 | 328 Adequate |
| Total for TOP-10 | 79,22 | 125,22 | 1 706,94 | 2 126,35 | |||
| Average value of TOP-10 | 7,92 | 12,52 | 170,69 | 212,63 | 1,08 | 1,46 | |
| Industry average value | 0,01 | 0,41 | 31,80 | 31,80 | 0,67 | 0,70 | |
Average asset turnover ratio of TOP-10 companies in 2016 is higher than the practical one and higher than the average industry value. In 2016 eight companies of TOP-10 have a ratio value higher, and two companies have a ratio lower than the practical one (green and orange colors respectively in columns 6 and 7 of Table 1 and in Picture 1). In 2016 three of TOP-10 companies have a decrease in net profit as compared to the prior period, or have loss (red highlight in column 3 of Table 1).
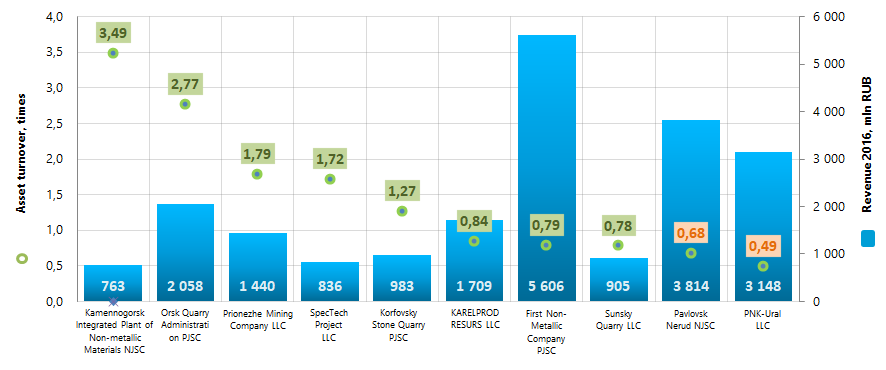 Picture 1. Asset turnover ratio and revenue of the largest Russian stone quarrying companies (TOP-10)
Industry average values of asset turnover ratio within the last 10 years follow a downward trend. In 2012-2015 the ratio value was lower than the 2016 practical value. This may indicate a certain downturn in the sector (Picture 2).
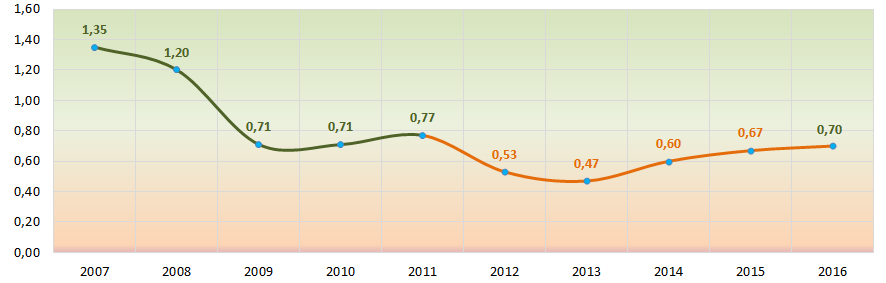 Picture 2. Change of industry average values of asset turnover ratio of Russian stone quarrying companies in 2007-2016
Eight of TOP-10 companies have got from superior to medium solvency index Globas, which indicates their ability to meet debt obligations timely and in full.
Kamennogorsk Integrated Plant of Non-metallic Materials NJSC and PNK-Ural LLC have got an adequate solvency index Globas, due to the companies being defendants in debt collection arbitration proceedings and loss within the balance sheet figures. Index development trends are stable.