
Order a report
Custom-made industry research, company ratings, competitor analysis


Total liquidity of sugar manufacturers
Information agency Credinform prepared a ranking of companies engaged in sugar manufacturing.
Companies with the mentioned activity type and the highest volume of revenue were selected for this ranking according to the data from the Statistical Register for the latest available period (for the year 2013). The enterprises were ranked by decrease in sales revenue. Total liquidity ratio was calculated for all companies of the ranking.
Total liquidity ratio (x) is a sum of working assets of the company to long-term liabilities. It shows the sufficiency of funds for repayment of short-term liabilities. The recommended value varies from 1,0 to 2,0.
The ratio assesses the liquidity of assets more overall. Since current liabilities are repaid mainly by means of current assets, the normal liquidity level requires the excess of current assets value over the sum of current liabilities. The normal value of the ratio is not less than 1. However, the industry classification of the company, structure of reserves, status of accounts receivable, production lead time and other factors influence the normal value.
The value of 1 supposes the equity of current assets and liabilities. Considering that the liquidity level of various assets parts differ significantly, one can concede that not all assets will be immediately realized or realized at the whole cost. This can invite a danger of weakening the company’s financial situation. Moreover, the enterprise should have some volume of inventories to continue the business after the repayment of all current liabilities.
If the value far exceeds 1, it can be concluded that the company have the significant volume of free resources, which were formed due to own source. Through the spectacle of creditors, this way of working assets formation is the most satisfactory. Alongside with that, according to the manager’s view, the significant inventory stockpiling and diversion of funds to accounts receivable can be connected with ineffective asset management. At the same time, the company probably uses its drawings possibilities not in full. This carries a threat of competitiveness loss due to the absence of investments in production growth and taking of new outlets.
| № | Name | Region | Revenue, mln. RUB, 2013 | Total liquidity ratio, (х) | Solvency index Globas-i® |
|---|---|---|---|---|---|
| 1 | OPEN JOINT STOCK COMPANY SUGAR PLANT ZNAMENSKY INN 6804000019 |
The Tambov region | 6 943,1 | 1,0 | 214 high |
| 2 | OPEN JOINT STOCK COMPANY VALUYKISAKHAR INN 3126000974 |
The Belgorod region | 5 341,2 | 1,5 | 230 high |
| 3 | ООО Kristall INN 6824004406 |
The Tambov region | 3 145,4 | 1,1 | 273 high |
| 4 | JSC "SUGAR PLANT DOBRINSKI" INN 4804000086 |
The Lipetsk region | 2 876,3 | 1,4 | 225 high |
| 5 | OPEN JOINT STOCK COMPANY SAKHARNYI ZAVOD LENINGRADSKY INN 2341006687 |
The Krasnodar Territory | 2 842,1 | 2,2 | 210 high |
| 6 | JOINT STOCK COMPANY USPENSKIY SAHARNIK INN 2357005329 |
The Krasnodar Territory | 2 772,7 | 1,0 | 246 high |
| 7 | CLOSED JOINT STOCK COMPANY KOLPNYANSKY SUGAR FACTORY INN 5711002822 |
The Orel region | 2 668,4 | 1,2 | 239 high |
| 8 | OPEN JOINT STOCK COMPANY LISKISUGAR INN 3652000739 |
The Voronezh region | 2 624,3 | 1,1 | 260 high |
| 9 | OAO Zainsky Sakhar INN 1647008721 |
The Republic of Tatarstan | 2 432,5 | 0,9 | 228 high |
| 10 | OJSC Olkhovatsky Sugar Factory INN 3618003708 |
The Voronezh region | 2 329,0 | 1,5 | 211 high |
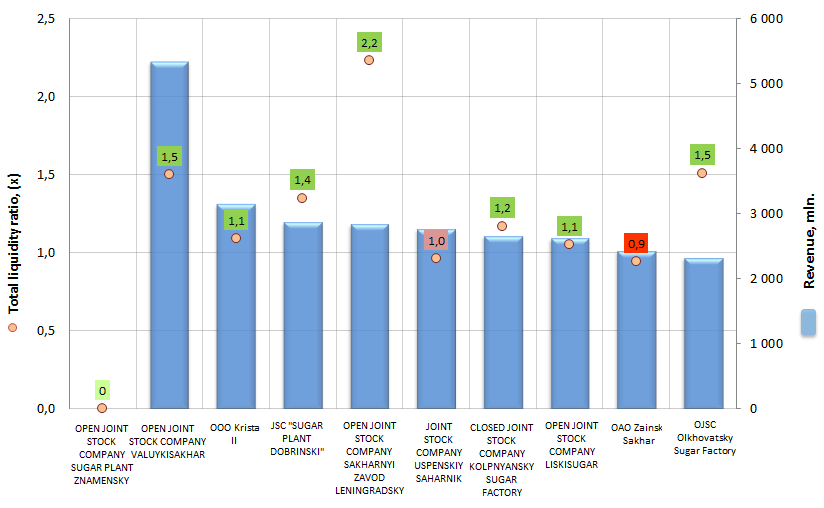
Figure. Total liquidity and revenue of the largest sugar manufacturers (Top-10)
According to the last published financial accounts (2013), the revenue of the largest sugar manufacturers of the RF (Top-10) amounted to 34,0 bln. RUB; the annual surplus is 4,4%.
According to the 2014 year end, 5 212 679 tons of sugar (sand sugar) were produced in Russia; that is by 6,3% higher than in 2013 (4 903 798 tons).
The best values of total liquidity ratio of the Russian largest sugar manufacturers belong to the following companies: OPEN JOINT STOCK COMPANY SAKHARNYI ZAVOD LENINGRADSKY (2,2), OPEN JOINT STOCK COMPANY VALUYKISAKHAR (1,5) and OJSC Olkhovatsky Sugar Factory (1,5).
Two of ten companies show the negative values: liabilities exceed assets (OAO Zainsky Sakhar (0,9) and JOINT STOCK COMPANY USPENSKIY SAHARNIK (less than 1,0)). This indicates over-crediting of companies and can be resulted in adverse consequences for the finance stability (assuming a one-time requirement of all creditors to repay debts).
All Top-10 companies got a high solvency index that shows the ability to timely and fully repay the debt with minimal risk of default.