
Order a report
Custom-made industry research, company ratings, competitor analysis


Product profitability of the largest Russian household electrical appliances manufacturers
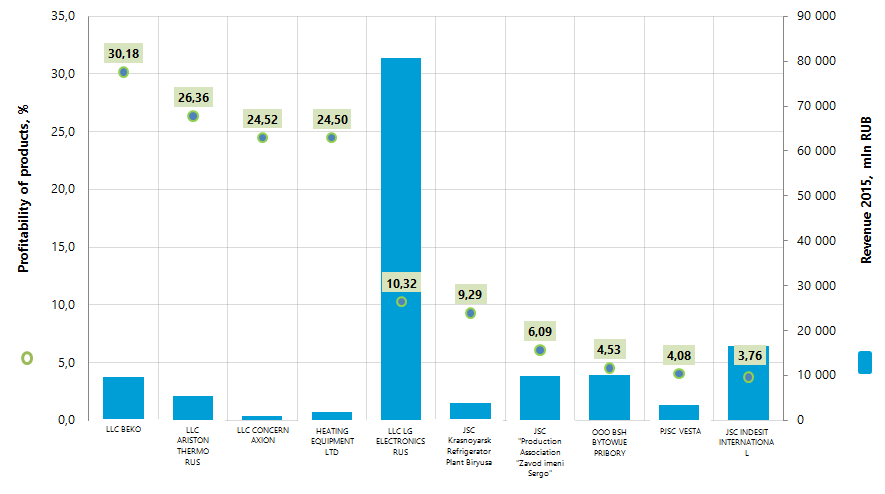
Information agency Credinform prepared a ranking of product profitability of the largest Russian household electrical appliances manufacturers. The Russian manufacturers (Top-10) with the highest volume of revenue were selected for this ranking according to the data from the Statistical Register for the latest available periods (2015 and 2014). The enterprises were ranked by decrease in product profitability (see table 1).
Product profitability is sales revenue to expenses from ordinary activities. Profitability in general indicates the economic efficiency of production. Analysis of product profitability allows to conclude about an output expediency. There is no standard value for profitability indicators, because they change in accordance with the industry the company operates in.
For the most complete and objective view of the financial condition of the enterprise it is necessary to pay attention to the complex of presented ratios, financial and other indicators of the company.
| Name, INN, region | Net profit 2015, mln RUB | Revenue 2015, mln RUB | Revenue 2015 to 2014, +/- % | Product profitability, % | Solvency index GLOBAS-i® |
|---|---|---|---|---|---|
| LLC BEKO INN 7804157910 Vladimir region |
1 191,5 | 9 577,3 | 3 | 30,18 | 168 The highest |
| LLC ARISTON THERMO RUS INN 4703066115 Leningrad region |
947,1 | 5 397,4 | 4 | 26,36 | 162 The highest |
| LLC CONCERN AXION INN 1831168300 the Republic of Udmurtia |
-40,1 | 972,4 | 165 | 24,52 | 276 High |
| HEATING EQUIPMENT LTD INN 4716025405 Leningrad region |
48,2 | 1 914,0 | 10 | 24,50 | 257 High |
| LLC LG ELECTRONICS RUS INN 5075018950 Moscow region |
2 470,7 | 80 695,4 | -17 | 10,32 | 224 High |
| JSC Krasnoyarsk Refrigerator Plant Biryusa INN 2451000695 Krasnoyarsk territory |
83,4 | 3 961,8 | 31 | 9,29 | 203 High |
| JSC "Production Association "Zavod imeni Sergo" INN 1648032420 the Republic of Tatarstan |
415,7 | 9 941,9 | 69 | 6,09 | 171 The highest |
| OOO BSH BYTOWIJE PRIBORY INN 7819301797 Saint-Petersburg |
-531,0 | 10 118,2 | 26 | 4,53 | 314 Satisfactory |
| PJSC VESTA INN 4346047144 Kirov region |
69,2 | 3 414,8 | 66 | 4,08 | 225 High |
| JSC INDESIT INTERNATIONAL INN 4823005682 Lipetsk region |
279,6 | 16 473,4 | 1 | 3,76 | 248 High |
| Total TOP-10 | 4 934,4 | 142 466,6 | -5 | 14,36* | |
| Total TOP-100 | 5 162,5 | 150 675,9 | -4 | 8,58* |
*) - average value by the group of companies
Average value of product profitability of the Top-10 companies in 2015 is higher than of the Top-100 at industry average value of 10,19%.
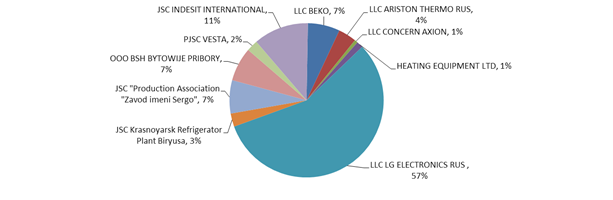
Revenue of 10 largest companies in 2015 is 95% of total revenue of the Top-100 companies, speaking about high monopolization in this sector. The share of LLC LG ELECTRONICS RUS, leading in term of 2015 revenue, amounted to almost 57% of the Top-10 total revenue (Picture 2).
Nine companies of the Top got high or the highest Solvency index GLOBAS-i® indicating their ability to timely and fully fulfill their debt liabilities.
OOO BSH BYTOWIJE PRIBORY got satisfactory index due to being a defendant in arbitration proceedings on debt recovery and loss in key figures. Index development trend is stable. Credit guarantees are recommended.
Four companies in the Top (marked with red in Table 1) have decrease in net profit or loss in 2015, or decrease in revenue in comparison with the previous period.
According to the data calculated on the basis of the Federal State Statistics Service (Table 2), from 2010 to 2016 the figures of household electrical appliances manufacture in volume terms are not stable. Following the results of 2016, there is an increase in production by 8% in comparison with 2015.
| Products | 2010 | 2011 | 2012 | 2013 | 2014 | 2015 | 2016 | 2016 to 2010, +/- % |
|---|---|---|---|---|---|---|---|---|
| Household washing machines | 2 699,5 | 3 030,4 | 3 335,7 | 3 830,3 | 3 879,9 | 3 485,0 | 4 018,3 | 48,8 |
| Electric water heaters | 4 658,1 | 4 564,8 | 4 659,5 | 4 523,5 | 3 879,7 | 3 400,9 | 3 456,7 | -25,8 |
| Household refrigerators | 3 555,8 | 4 101,5 | 4 316,0 | 4 113,6 | 3 723,4 | 3 118,3 | 3 291,8 | -7,4 |
| Electric lights for residential premises | 318,7 | 1 550,6 | 1 656,0 | 1 964,2 | 1 982,5 | 1 474,4 | 2 301,5 | 722,2 |
| Household electric hobs | 1 539,7 | 1 516,5 | 1 463,1 | 1 165,7 | 946,8 | 1 195,0 | 746,2 | -51,5 |
| Household kitchen combined gas-electric and electric cookers | 558,1 | 502,2 | 430,9 | 353,1 | 379,8 | 474,2 | 536,1 | -3,9 |
| Electric meat mincer | 724,1 | 682,5 | 553,2 | 479,6 | 294,5 | 376,7 | 505,1 | -30,2 |
| Household microwave ovens | 1 065,9 | 1 379,1 | 1 030,6 | 925,2 | 1 284,7 | 463,8 | 309,1 | -71 |
| Electric shavers | 582,1 | 491,1 | 300,6 | 238,7 | 293,3 | 297,4 | 301,5 | -48,2 |
| Electric cabinet ovens (household electric oven) | 45,5 | 37,6 | 24,2 | 14,7 | 14,2 | 36,2 | 89,9 | 97,6 |
| Electric kettles and samovars | 173,1 | 270,4 | 263,3 | 271,9 | 87,8 | 158,4 | 78,2 | -54,8 |
| Electric juicers | 52,4 | 33,2 | 18,9 | 17,4 | 25,1 | 39,4 | 48,9 | -6,7 |
| Household fans | 25,8 | 23,4 | 20,4 | 15,6 | 18,7 | 19,2 | 42,5 | 64,7 |
| Household vacuum cleaners | 231,5 | 111,4 | 60,6 | 51,8 | 55,1 | 17,7 | 13,1 | -94,3 |
| Electric irons | 65,0 | 32,4 | 24,7 | 0,5 | 1,3 | 0,4 | 1,0 | -98,5 |
| Total | 16 295,5 | 18 327,2 | 18 157,8 | 17 965,9 | 16 866,8 | 14 556,9 | 15 739,9 | -3,4 |
*) decrease in production is marked with red and increase is marked with green in Table 2. Types of products are ranked by the volume of production in 2016.
The maximal stability from 2010 to 2016 was demonstrated by manufacture of household washing machines and electric lights.
Enterprises engaged in household electrical appliances manufacture are distributed quite evenly along the country. Mostly they are located in the industrially developed regions with infrastructure for hi-tech manufacturing. According to the Information and analytical system Globas-i 100 companies largest in the sector and with the highest volume of revenue for 2015 are registered in 35 regions of Russia (Picture 3).
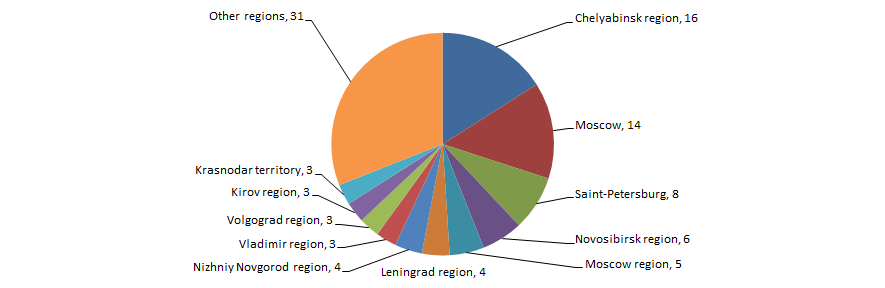
The leading position of Chelyabinsk region is noticeable.