
Order a report
Custom-made industry research, company ratings, competitor analysis


Trends in chemical industry
Information agency Credinform has prepared a review of trends in activity of the largest Russian chemical companies. The largest Russian chemical companies (TOP-10 and TOP-1000) in terms of annual revenue were selected according to the data from the Statistical Register for the latest available periods (2014 - 2017). The analysis was based on data of the Information and Analytical system Globas.
Net assets is a ratio reflecting the real value of company's property. It is calculated annually as the difference between assets on the enterprise balance and its debt obligations. The ratio is considered negative (insufficiency of property), if company’s debt exceeds the value of its property.
| № | Name, INN, region, activity |
Net assets value, bln RUB |
Solvency index Globas | ||
| 2015 | 2016 | 2017 | |||
| 1 | 2 | 3 | 4 | 5 | 6 |
| 1 | JSC URALKALI INN 5911029807 Perm region Manufacture of fertilizers and nitrogen compounds |
102.6 | |
|
189 High |
| 2 | JSC Nizhnekamskneftekhim INN 1651000010 Republic of Tatarstan Manufacture of synthetic rubber in primary forms |
92.0 | |
|
134 Superior |
| 3 | JSC TOGLIATTIAZOT INN 6320004728 Samara region Manufacture of fertilizers and nitrogen compounds |
69.0 | |
|
199 High |
| 4 | Kazan JSC Organichesky Sintez INN 1658008723 Republic of Tatarstan Manufacture of plastics in primary forms |
35.2 | |
|
127 Superior |
| 5 | JSC MINUDOBRENIYA INN 3627000397 Voronezh region Manufacture of fertilizers and nitrogen compounds |
39.8 | |
|
200 Strong |
| 996 | KEMEROVO JSC AZOT INN 4205000908 Kemerovo region Manufacture of fertilizers and nitrogen compounds |
-9.1 | |
|
194 High |
| 997 | JSC EKOPET INN 3904087321 Kaliningrad region Manufacture of plastics in primary forms |
-10.6 | |
|
313 Adequate |
| 998 | Public Stock Company Soda Crimea Plant INN 9106001900 Republic of Crimea Manufacture of other inorganic basic chemicals |
-4.0 | |
|
252 Medium |
| 999 | BOR MINING CHEMICAL COMPANY INN 2505009506 Moscow Manufacture of other inorganic basic chemicals Process of being wound up,17.02.2016 |
-6.6 | |
|
600 Insufficient |
| 1000 | JOINT STOCK COMPANY UNITED CHEMICAL COMPANY URALCHEM INN 7703647595 Moscow Manufacture of fertilizers and nitrogen compounds In process of reorganization in the form of merger of other legal entities, 13.07.2018 |
-83.0 | |
|
273 Medium |
![]() — growth indicator in comparison with prior period,
— growth indicator in comparison with prior period, ![]() — decline indicator in comparison with prior period.
— decline indicator in comparison with prior period.
For the last ten years, the average values of TOP-1000 net assets showed the increasing tendency (Picture 1).
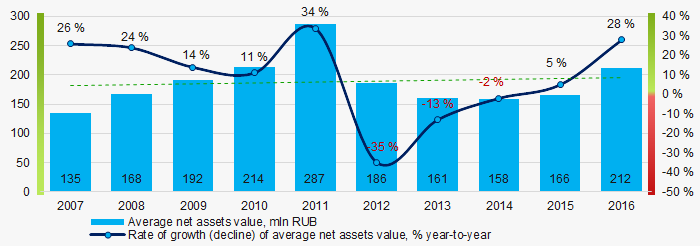 Picture 1. Change in average net assets value of chemical companies in 2007 – 2016
 For the last three years, the share of enterprises with lack of property is growing (Picture 2).
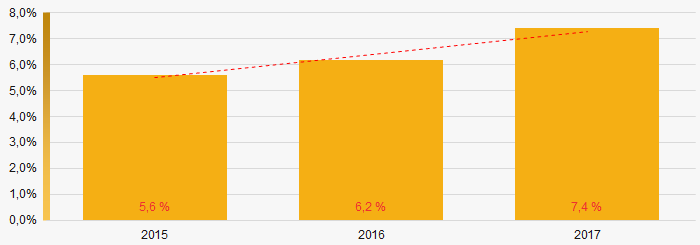 Picture 2.The share of enterprises with negative net assets value in ТОP-1000
Sales revenue
In 2016, the total revenue of 10 largest companies amounted to 34% from ТОP-1000 total revenue (Picture 3). This fact testifies high level of competition within the industry.
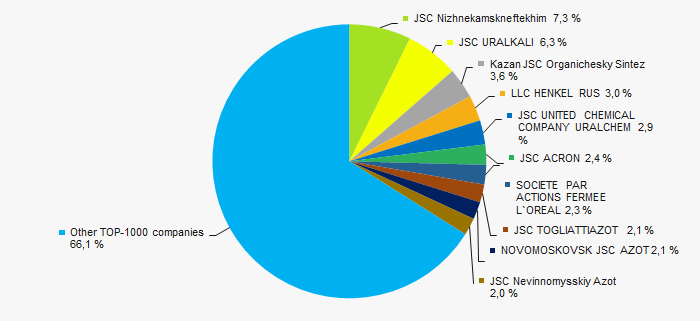 Picture 3. Shares of TOP-10 in TOP-1000 total revenue for 2016
In general, the relative stability in sales revenue is observed (Picture 4).
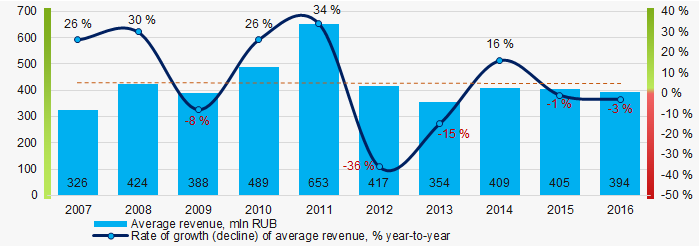 Picture 4. Change in average revenue of chemical companies in 2007 – 2016
 Profit and loss
In 2016 profit of 10 largest companies amounted to 63% from TOP-1000 total profit (Picture 5).
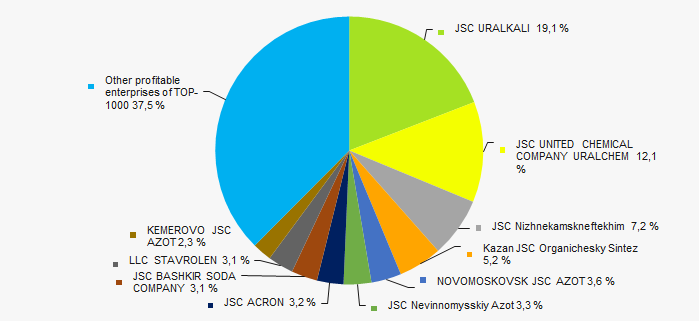 Picture 5. Shares of TOP-10 companies in TOP-1000 total profit for 2016
For the last ten years, the average net profit values show the growing tendency (Picture 6).
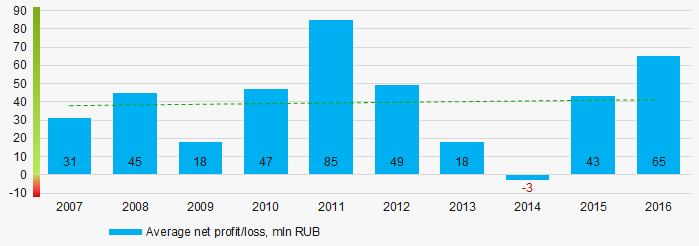 Picture 6. Change in average net profit of chemical companies in 2007 – 2016
Main financial ratios
For the last ten years, the average values of the current liquidity ratio were within the recommended values - from 1.0 to 2.0 (Picture 7).
The current liquidity ratio (ratio of total working capital to short-term liabilities) shows the sufficiency of company’s assets to meet short-term obligations.
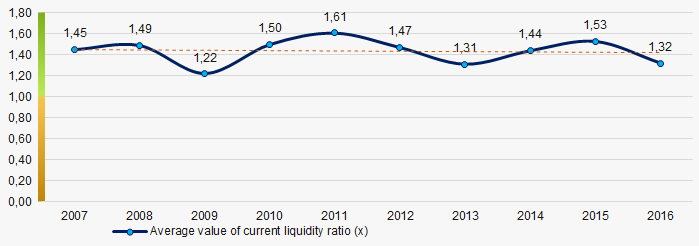 Picture 7. Change in average values of current liquidity ratio of chemical companies in 2007 – 2016
 For the last ten years, the decreasing tendency of ROI ratio is observed (Picture 8).
The ROI ratio is calculated as a ratio of net profit to sum of stockholder equity and long-term liabilities and shows the return from equity involved in commercial activities and long-term borrowed funds.
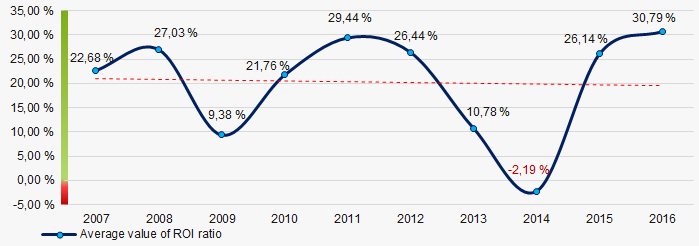 Picture 8. Change in average values of ROI ratio in 2007 – 2016
 Assets turnover ratio is the ratio of sales revenue and company’s average total assets for a period. It characterizes the effectiveness of using of all available resources, regardless the source of their attraction. The ratio shows how many times per year the full cycle of production and circulation is performed, generating the corresponding effect in the form of profit.
For the last ten years, this business activity ratio demonstrated the downward trend (Picture 9).
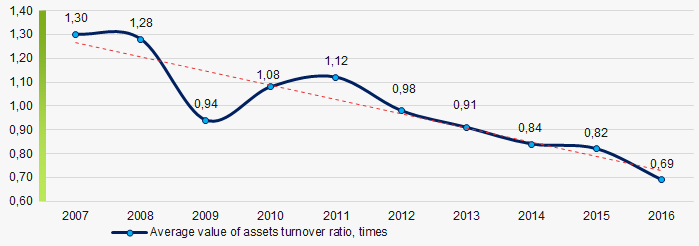 Picture 9. Change in average values of assets turnover ratio of chemical companies in 2007 – 2016
 Production structure
The largest share in TOP-1000 total revenue is held by enterprises engaged in manufacture of fertilizers and nitrogen compounds (Picture 10).
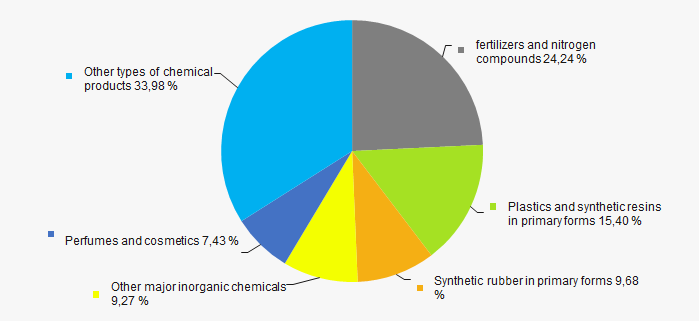 Picture 10. Distribution of manufactured products in TOP-1000 total revenue, %
67% of ТОP-1000 companies are registered in the Unified register of small and medium-sized enterprises of the Russian Federal Tax Service (Picture 11).
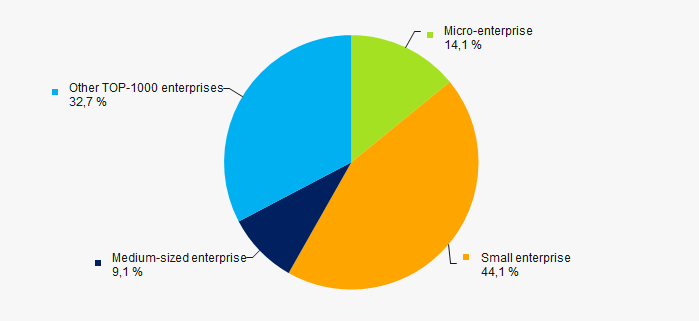 Picture 11. Shares of small and medium-sized enterprises in ТОP-1000, %
Main regions of activity
Companies of ТОP-1000 are unequally located across the country and registered in 63 regions of Russia. The largest enterprises in terms of revenue are located in Moscow and Republic of Tatarstan (Picture 12).
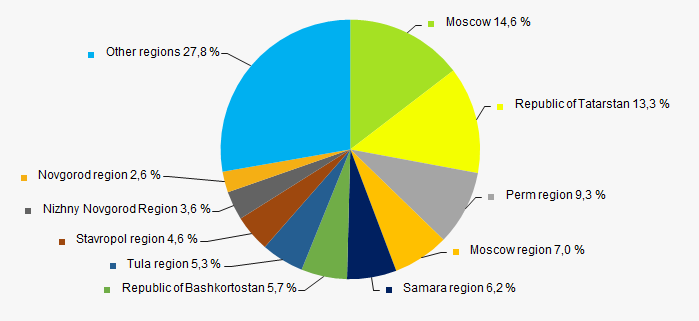 Picture 12. Distribution of TOP-1000 revenue by the regions of Russia
Financial position score
An assessment of the financial position of TOP-1000 companies shows that almost half of them have above average financial position (Picture 13).
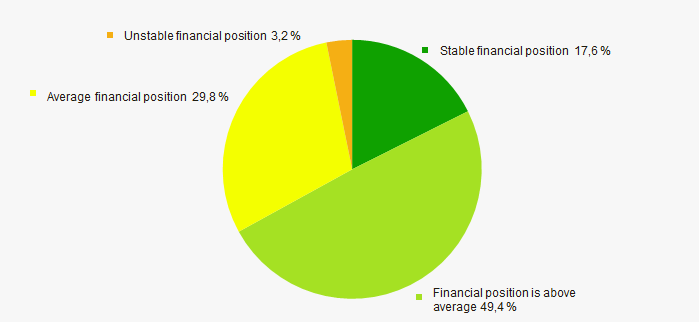 Picture 13. Distribution of TOP-1000 companies by financial position score
Solvency index Globas
Most of TOP-1000 companies got superior/high or strong/medium Solvency index Globas, this fact shows the ability of the companies to meet their obligations in time and fully (Picture 14).
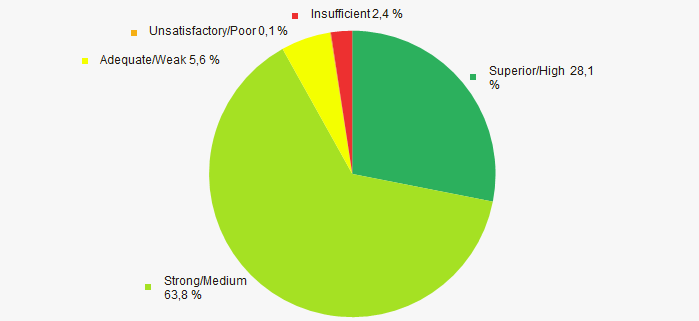 Picture 14. Distribution of TOP-1000 companies by Solvency index Globas
 Conclusion
A complex assessment of activity of the largest Russian chemical companies, taking into account the main indexes, financial ratios and indicators, demonstrates the presence of favorable trends. However, the growing share of enterprises with lack of property, decrease in average values of ROI and assets turnover ratios are negative factors.
According to the Federal State Statistics Service (Rosstat), in general, within 2017 - 2018 the slight increase of industrial production indexes in the chemical industry is observed (Picture 15).
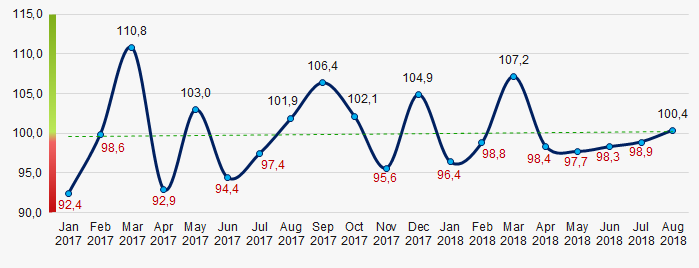 Picture 15. Industrial production indexes in the chemical industry in 2017 - 2018, month-to-month (%)