
Order a report
Custom-made industry research, company ratings, competitor analysis


Assets turnover ratio of the largest Russian companies engaged in sand, gravel, clay and kaolin extraction
Information Agency Credinform http://www.credinform.ru/en-US has prepared the ranking of the largest Russian companies engaged in sand, gravel, clay and kaolin extraction. The largest enterprises (TOP-10) in terms of annual revenue were selected according to the data from the Statistical Register for the latest available periods (2016 and 2015). Then the companies were ranged by assets turnover ratio (Table 1). The analysis was based on data of the Information and Analytical system Globas.
Assets turnover is the ratio of sales revenue and company’s average total assets for a period. Показатель относится к группе коэффициентов деловой активности and characterizes the effectiveness of using of all available resources, regardless the source of their attraction. The ratio shows how many times per year the full cycle of production and circulation is performed, generating the corresponding effect in the form of profit.
The calculation of practical values of financial indicators, which might be considered as normal for a certain industry, has been developed and implemented in the Information and Analytical system Globas by the experts of Information Agency Credinform, taking into account the actual situation of the economy as a whole and the industries. In 2016 the practical value of assets turnover ratio for the companies engaged in sand, gravel, clay and kaolin extraction starts from 0,68.
For the most full and fair opinion about the company’s financial position, the whole set of financial indicators and ratios of the company should be taken into account.
| Name, INN, region | Net profit, mln RUB | Revenue, mln RUB | Assets turnover ratio, times | Solvency index Globas | |||
| 2015 | 2016 | 2015 | 2016 | 2015 | 2016 | ||
| 1 | 2 | 3 | 4 | 5 | 6 | 7 | 8 |
| NAO KAMENNOGORSKOE KARYEROUPRAVLENIE INN 4704002227 Leningrad region |
-3,0 | -23,8 | 1 025,9 | 1 016,6 | 2,90 | 2,95 | 292 Medium |
| LLLC DONSKOI KAMEN INN 6148556263 Rostov region |
115,0 | 44,8 | 2 434,1 | 12 783,0 | 2,71 | 2,57 | 260 Medium |
| NAO NOVOSIBIRSKOE KARYEROUPRAVLENIE INN 5403102519 Novosibirsk region |
149,2 | 81,7 | 2 104,2 | 2 108,7 | 1,68 | 1,68 | 242 Strong |
| LLC BENTONIT KHAKASII INN 1903023547 The Republic of Khakassia |
137,2 | 179,8 | 774,9 | 1 065,8 | 1,39 | 1,58 | 175 High |
| LLC Bogaevskii quarry INN 5075019720 Moscow region |
92,4 | 237,1 | 608,4 | 837,9 | 1,22 | 1,41 | 231 Strong |
| LLC LAFARGE AGGREGATES AND CONCRETE INN 7705155052 The Republic of Karelia |
-380,9 | -322,7 | 1 069,9 | 1 631,0 | 0,76 | 1,17 | 303 Adequate |
| NAO BOGAEVSKII QUARRY INN 5075011344 Moscow region |
139,8 | 329,5 | 1 214,1 | 1 528,0 | 0,93 | 1,01 | 200 Strong |
| LLC OBLNERUDPROM INN 5007038980 Moscow region |
34,5 | 62,3 | 772,2 | 836,4 | 0,96 | 1,01 | 239 Strong |
| LLC SEVERENERGO INN 8911023007 Tyumen region |
117,8 | 172,9 | 287,9 | 1 028,7 | 0,35 | 0,98 | 216 Strong |
| PAO RAMENSKII MINING AND REFINING PLANT INN 5040002187 Moscow region |
139,8 | 170,0 | 1 477,5 | 1 580,9 | 0,83 | 0,83 | 215 Strong |
| Total for TOP-10 group of companies | 541,8 | 931,5 | 11 768,9 | 14 417,1 | |||
| Average value within TOP-10 group of companies | 54,2 | 93,1 | 1 176,9 | 1 441,7 | 1,37 | 1,52 | |
| Industry average value | 0,06 | 0,03 | 31,8 | 36,5 | 0,67 | 0,68 | |
In 2016, the average value of assets turnover ratio within TOP-10 group of companies is higher than practical and industry average values. In 2016, all companies from TOP-10 list have values higher than practical value (green color in column 7 of Table 1 and Picture 1). Four companies from TOP-10 list have decrease in net profit and revenue or have loss (red color in columns 3 and 5 of Table 1).
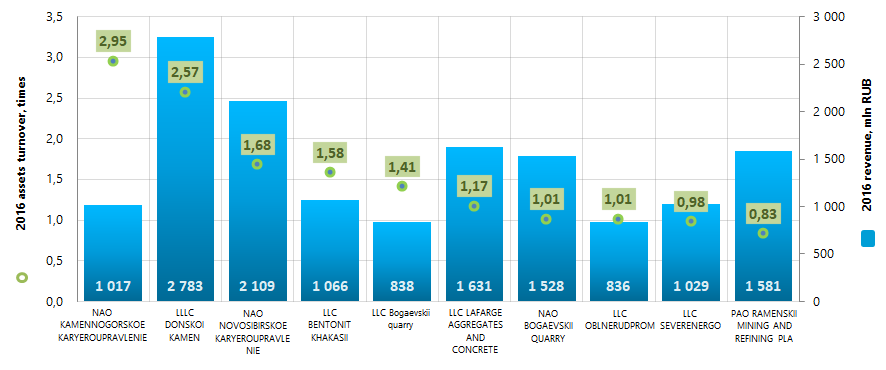 Picture 1. Assets turnover ratio and revenue of the largest Russian companies engaged in sand, gravel, clay and kaolin extraction (TOP-10)
For the last 10 years, the average values of assets turnover ratio showed negative trend. From 2012 to 2015, the values were lower than 2016 practical values. This may be a sign of economic slowdown in the industry (Picture 2).
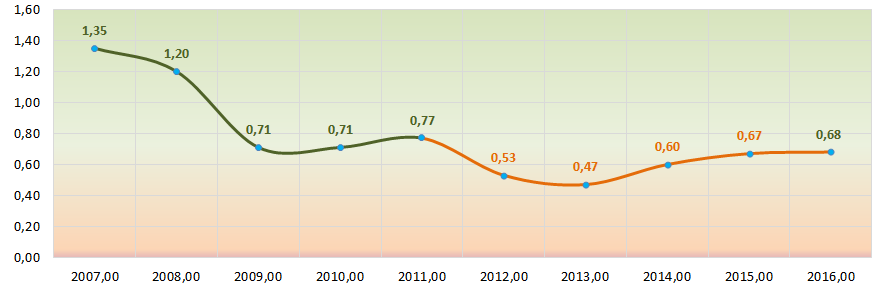 Picture 2. The change of assets turnover ratio average values within 2007-2016 for the Russian companies engaged in sand, gravel, clay and kaolin extraction
 Nine companies from TOP-10 list have the upper levels of solvency index Globas, this fact shows the ability of the companies to meet their obligations in time and fully.
LLC LAFARGE AGGREGATES AND CONCRETE has adequate level of solvency index Globas due to participation as a defendant in debt collection arbitration proceedings, late fulfillment of obligations and losses in balance figures. The forecast for index development is stable.