
Order a report
Custom-made industry research, company ratings, competitor analysis


Profit level of construction companies
Information agency Credinform has prepared a ranking of the largest Russian companies engaged in specialized building activity. The largest enterprises (TOP-10) in terms of annual revenue were selected according to the data from the Statistical Register for the available periods (2016-2018). Then the companies were ranged by net profit ratio (Table 1). The analysis was based on the data from the Information and Analytical system Globas.
Net profit ratio (%) is calculated as a ratio of net profit (loss) to sales revenue. The ratio reflects the company’s level of sales profit.
The ratio doesn’t have the standard value. It is recommended to compare the companies within the industry or the dynamics of a ratio for a certain company. The negative value of the ratio indicates about net loss. The higher is the ratio value, the better the company operates.
For the most full and fair opinion about the company’s financial position the whole set of financial indicators and ratios should be taken into account.
| Name, INN, region | Revenue, million RUB | Net profit (loss), million RUB | Net profit ratio, % | Solvency index Globas | |||
| 2017 | 2018 | 2017 | 2018 | 2017 | 2018 | ||
| 1 | 2 | 3 | 4 | 5 | 6 | 7 | 8 |
| KORPORATSIYA AKTSIONERNOI KOMPANII ELEKTROSEVKAVMONTAZH INN 2312065504 Krasnodar region |
|
|
|
|
|
|
176 High |
| MODERN MINING TECHNOLOGIES LLC INN 4205185423 Kemerovo Region - Kuzbass |
|
|
|
|
|
|
214 Strong |
| LSR. STROITELSTVO-SZ LLC INN 7802862265 St. Petersburg |
|
|
|
|
|
|
228 Strong |
| SPETSSTROISERVIS LLC INN 1644040406 Republic of Tatarstan |
|
|
|
|
|
|
204 Strong |
| ESTA KONSTRUCTION LLC INN 7704615959 Moscow |
|
|
|
|
|
|
242 Strong |
| JSC TRUST KOKSOKHIMMONTAZH INN 7705098679 Moscow |
|
|
|
|
|
|
180 High |
| JSC RZDSTROY INN 7708587205 Moscow |
|
|
|
|
|
|
245 Strong |
| ZAPOLYARNAYA STROITELNAYA KOMPANIYA LLC INN 2457061775 Krasnoyarsk region |
|
|
|
|
|
|
272 Medium |
| LLC SPECIALIZED CONSTRUCTION COMPANY GAZREGION INN 7729657870 Moscow |
|
|
|
|
|
|
326 Adequate |
| LLC BRYANSKAGROSTROY INN 3250521869 Bryansk region |
|
|
|
|
|
|
313 Adequate |
| Average value for TOP-10 companies | |
|
|
|
|
|
|
| Average industry value | |
|
|
|
|
|
|
![]() growth of indicator in comparison with prior period,
growth of indicator in comparison with prior period, ![]() decline of indicator in comparison with prior period
decline of indicator in comparison with prior period
In 2018, the average value of net profit ratio for TOP-10 companies is lower than average industry value: seven companies improved the results.
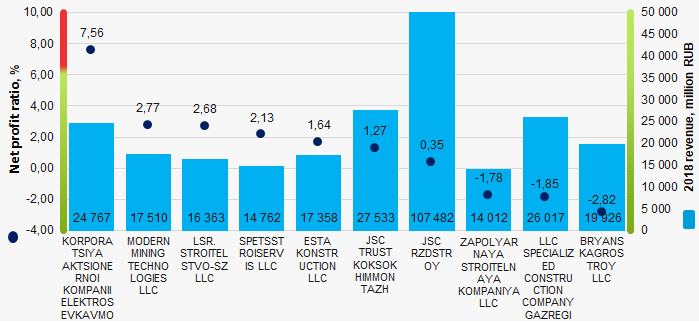 Picture 1. Net profit ratio and revenue of the largest Russian companies engaged in specialized building activity (ТОP-10)
Within 10 years, the average industry indicators of the net profit ratio showed the decreasing tendency. (Picture 2).
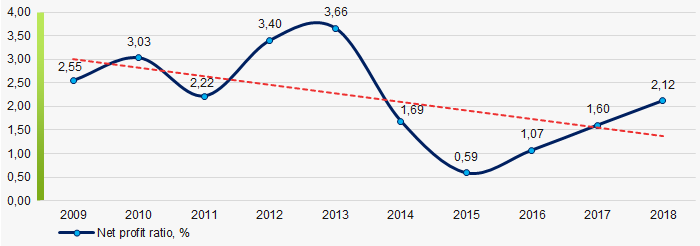 Picture 2. Change in average industry values of the net profit ratio of Russian companies engaged in specialized building activity in 2009 – 2018