TOP-10 Men's Super League volleyball clubs
Information Agency Credinform presents a ranking of Men's Super League volleyball clubs by assets. Using the Information and Analytical System Globas, the experts of the Agency selected Top-10 of volleyball teams with the largest amount of assets. The experts also analyzed incomes of the Russian volleyball clubs.
Super League is the Russian volleyball championship among men's teams. It is the annual competition of volleyball clubs organized by the Volleyball Federation of Russia (VFR).
The tournament has been held since 1992. It is the most prestigious and first strongest division of professional volleyball in Russia, where the winner of the playoffs becomes the champion. Participants in the playoffs are determined by the results of the regular season, which consists of 26 games, during which the teams score points. The championship is attended by 14 teams. Volleyball clubs that took the first eight places continue to fight for the main trophy, and the rest are fighting to maintain a place in the top division, playing a two-round tournament (play-out). The team that took the last place leaves the Super League. The club that has finished next to last, plays transitional matches for the right to stay in the country's top championship.
As in basketball, the value of a player is determined by his contract, i.e. the amount that a sports organization spends on paying a salary to a player while he plays for a club.
It is significant that the transitions of players between clubs are possible only at the full consent both of a player and club in which he plays. Every transition is thoroughly examined by the Transition committee, and then approved by the VFR Executive committee. This approach allows to avoid unfair competition and struggle for the player, as well as to protect all parties from various problems (financial, administrative, criminal or moral).
Sometimes it is very difficult to achieve satisfaction of all parties, therefore, in most cases, the transition to other teams is carried out with the status of a free agent, i.e. at the moment when the contract expired and all the obligations of the player to the club are fully fulfilled. If a Russian player is transferred from the Super League to a foreign club, then foreign representatives have to pay additional 2000 Euro to the All-Russian Volleyball Federation for a transfer certificate, which gives the player the right to transfer to a foreign team.
Salary projects of volleyball clubs are low. Players of Kazan Zenit have the largest income: from 3,4 to 7,8 million RUB per month. Players of the top five teams - Zenit (Saint Petersburg), Lokomotiv, Belogorye and Dynamo - earn on average up to 4,9 million RUB per month. The average salary of clubs from the second part of the table does not exceed 1 million RUB per month.
| Rank | Name | Balance sheet assets, million RUB | Income, million RUB | Net profit (loss), million RUB |
| 1 | VC Zenit (Kz) Kazan |
288,9 | 817,5 | 20,9 |
| 2 | PSVC Ural Ufa |
248,2 | 27,0 | 10,1 |
| 3 | VC Lokomotiv Novosibirsk |
128,6 | 474,9 | 450,1 |
| 4 | VC Belogorye Belgorod |
77,8 | 61,1 | 7,6 |
| 5 | VC Zenit (Spb) Saint Petersburg |
70,2 | 1,4 | -201,1 |
| 6 | VC Yaroslavich Yaroslavl |
52,2 | 40,0 | 0,0 |
| 7 | VC Gazprom-Yugra Surgut |
37,0 | 26,2 | -0,5 |
| 8 | VC Dinamo Moscow |
26,1 | 49,2 | 0,3 |
| 9 | VC Fakel Novy Urengoi |
24,5 | 3,0 | 1,2 |
| 10 | VC Kuzbass Kemerovo |
22,1 | 11,8 | 6,6 |
Source: Information and Analytical System Globas, by Credinform; Official website of the Volleyball Federation of Russia; calculations by Credinform.
VC Zenit-Kazan with the highest balance sheet assets (288,9million RUB) is the first in the ranking. Currently, the club is the second largest club in the history of domestic volleyball: it won many trophies of championships in the USSR, Russia and Europe. The club from Kazan won first places in various tournaments for 32 times, being second to only CSKA with over 52 titles. However, in 2009 CSKA team withdrew from the Super League, disbanded and ceased to exist. The income of club from Kazan is the highest in the league, due to the media and the results that the team shows. In addition, net profit for 2017 amounted to 20,9 million RUB.
The second is PSVC Ural from Ufa Total balance sheet assets of the club are less than of the Top leader’s by only 40 million RUB (248,2 million RUB). However, the team from Ufa is behind Kazan team by the rest of terms. In the entire history of PSVC, the Urals have never become the winner of the Super League and have been the silver medalist of various championships only a few times for 27 years. It is noteworthy that the club is able to support its activities at its own expense. Following the results of 2017, net profit of the Ufa team is 10,1 million RUB.
VC Lokomotiv is ranked the third. Like PSVC Ural, VC Lokomotiv has never won domestic championships: once it won the second place, but in the season 2012/13 the team won the international trophy – the cup of CEV Champions League1. Lokomotiv won the national championship in volleyball for several times, and it is the finalist of the club world championship. In terms of income, the club is the second in the Super League (474,9 million RUB), and has no equal in terms of net profit (450,1 million RUB).
VC Belogorye is the third in the list of the most titled clubs in Russia. The Belgorod team became the country's champion for 8 times and was a multiple winner of international tournaments. In 2014 the team won the club world volleyball championship. The assets volume of VC Belogorye is 3,5 times less than the leader of the list. However, the club is not inferior in terms of sports potential, cups and victories. Having a relatively small income, net profit of the team was 12,5% of total income at the end of 2017.
The fifth is the club from St. Petersburg. VC Zenit (Spb) was formed in 2017. From the very beginning, the team became the silver prize winner in the championship of Russia and champion’s title contender. The team from Saint Petersburg has the smallest earnings and the largest loss among the entire Top. The club receives funding mainly from the state-owned corporation JSC Gazprom, as well as from other state and private investors.
One of the most titled teams in Russia, VC Dinamo is ranked only 8th in terms of balance assets (26,1 million rubles). Despite the fact that the club is owned by government agencies, the organization has been showing profits for 5 years.
The tenth is the current champion of the Men's Super League – VC Kuzbass. For the first time in its history, the club became the gold prize winner of the Russian Volleyball Championship in the season 2018/19. In the final of the playoffs, the Siberian team beat VC Zenit (Kazan) and won the long-awaited title. In addition, the club demonstrates good financial figures: net profit for 2017 amounted to 56% of revenue, which indicates the efficient use of funds and right strategy.
The remaining teams did not achieve serious success in the championship of Russia: the playoffs ended mainly at the first stage, or at the struggle for the opportunity to stay in the top division. Such unsatisfactory results are explained by poor financing of the regional sport of Russia. Large sponsors are wary of investing in the development of sports since the support is long-term, and the return on investment is low. However, the trend may change in the near future. Sports organizations become self-sustaining, their activities gradually bring not only income, but also profit, and regional teams will be able to claim victory in the Super League.
It is noteworthy that only two club from TOP-10 are privately owned. VC Belogorye belongs to Shipulin Gennady Yakovlevich. Mr. Shipulin is the Honored Coach of Russia in volleyball, and the former head coach of VC Belogorye. In a very short time, he managed to turn a provincial club into the flagship of the Russian volleyball, which forced Belgorod to call the Old World volleyball capital at the beginning of this century due to its victories in Russia and triumphs in the Champions League.
VC Gzprom-Yugra is equally owned by three individuals.
Unlike basketball and hockey, 7 out of 10 Men's Super League volleyball clubs are non-profit organizations – VC Zenit (Kz), PSVC Ural, VC Lokomotiv, VC Zenit, VC Yaroslavich, VC Fakel and VC Kuzbass.
Dynamo volleyball team, like football and hockey clubs of the same name, is owned by the Russian security agencies.
The results of the ranking showed that regional teams are gradually starting to achieve success, unlike football or basketball. VC Belogorye and VC Kuzbass became champions of the national championship with serious competition from other equally eminent teams. A well-built strategy, moderate funding and a focus on results allowed regional representatives to take first places not only in the domestic championship, but also in the international arena.
1CEV Champions League is the main annual volleyball tournament among club teams in Europe
Trends in sugar production
Information agency Credinform has prepared a review of trends of the largest companies engaged in sugar production.
The largest enterprises (TOP-10 and TOP-100) in terms of annual revenue were selected for the analysis according to the data from the Statistical Register for the latest available periods (2015-2017). The analysis was based on the data of the Information and Analytical system Globas.
Net assets are total assets less total liabilities. This indicator reflects the real value of the property of an enterprise. When the company’s debt exceeds the value of its property, the indicator is considered negative (insufficiency of property).
The largest company in term of net assets is JSC SUGAR PLANT LENINGRADSKY. In 2018, net assets value of the company exceeded 5,8 billion RUB.
The lowest net assets volume among TOP-100 belonged to LLC SUGAR PLANT KOLPNYANSKY. In 2018, insufficiency of property of the company was indicated in negative value of -2,3 billion RUB.
Covering the ten-year period, the average net assets values have a trend to increase (Picture 1).
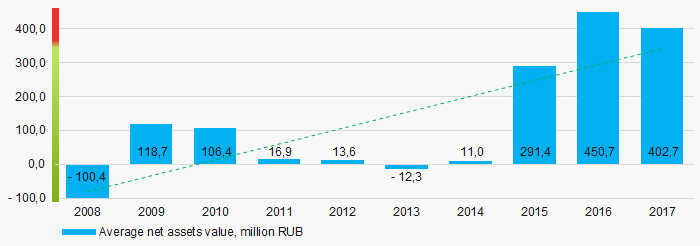 Picture 1. Change in average net assets value in 2008 – 2017
The shares of TOP-100 companies with insufficient property have trend to increase over the past three years (Picture 2).
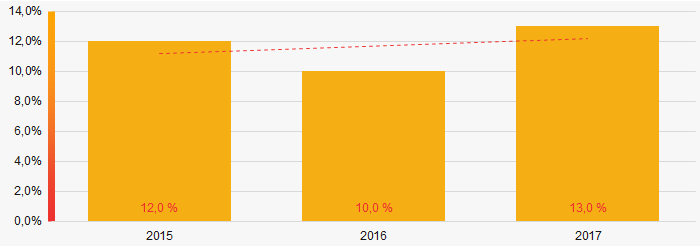 Picture 2. Shares of companies with negative net assets value in TOP-100, 2015-2017
Sales revenue
In 2017, total revenue of 10 largest companies of was 39% of TOP-100 total revenue (Picture 3). This testifies high level of monopolization in the industry.
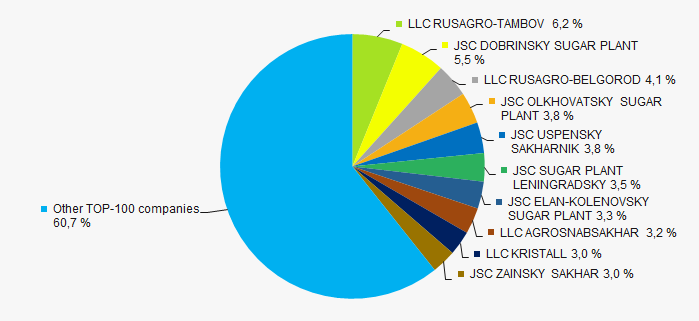 Picture 3. Shares of TOP-10 companies in TOP-100 total profit for 2017
Covering the ten-year-period, there is an increase in industry average revenue (Picture 4).
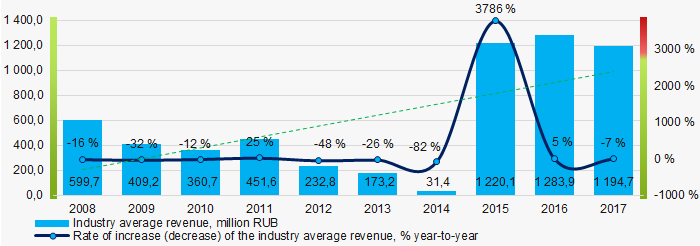 Picture 4. Change in industry average net profit in 2008-2017
Profit and loss
The largest company in term of net profit is JSC USPENSKY SAKHARNIK. The company’s profit for 2018 amounted to 1,2 billion RUB. Over the ten-year period, there is a trend to increase in average net profit (Picture 5).
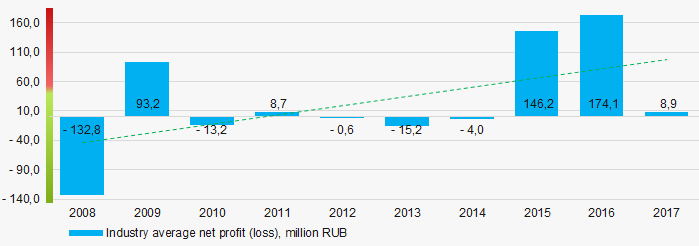 Picture 5. Change in industry average net profit values n 2008-2017
For the three-year period, the average net profit values of TOP-100 companies decreased with the average net loss value having the increasing trend (Picture 6).
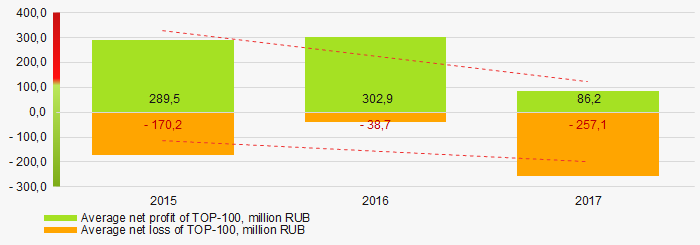 Picture 6. Change in average net profit and net loss of ТОP-100 in 2015 – 2017
Key financial ratios
For the ten-year period, the average values of the current liquidity ratio were often below the recommended one - from 1,0 to 2,0 with a trend to increase (Picture 7).
Current liquidity ratio (current assets to short-term liabilities) shows the sufficiency of company’s assets to repay on short-term liabilities.
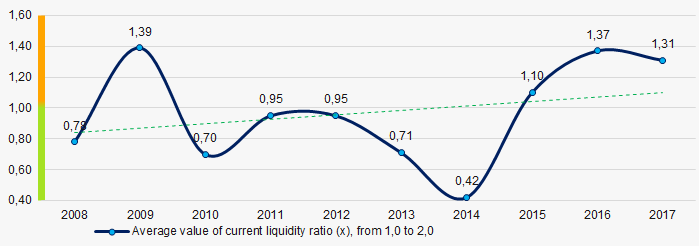 Picture 7. Change in industry average values of current liquidity ratio in 2008 – 2017
For the ten-year period, the average values of ROI ratio were on a quite high level with a trend to decrease (Picture 8).
ROI ratio is calculated as net profit to sum of shareholders equity and long-term liabilities, and shows the return of equity involved in commercial activities and long-term borrowed funds.
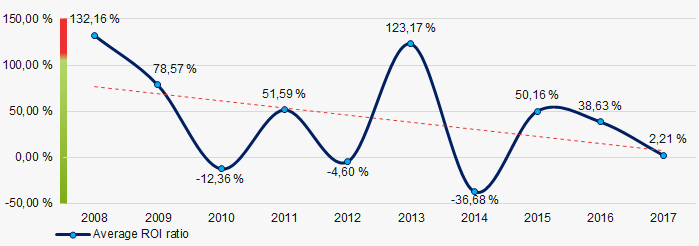 Picture 8. Change in average values of ROI ratio in 2008 – 2017
Assets turnover ratio is the ratio of sales revenue and company’s average total assets for a period. It characterizes the effectiveness of using of all available resources, regardless the source of their attraction. The ratio shows how many times per year the full cycle of production and circulation is performed, generating the corresponding effect in the form of profit.
For the ten-year period, business activity ratio demonstrated the increasing trend (Picture 9).
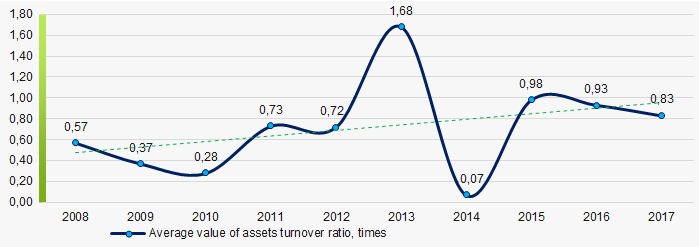 Picture 9. Change in average values of assets turnover ratio in 2008 – 2017
Small enterprises
35% companies of TOP-100 are registered in the Register of small and medium-sized enterprises of the Federal Tax Service of the Russian Federation. At the same time, their share in total revenue for 2017 slightly exceeded 2% that is significantly lower than the national average figure (Picture 10).
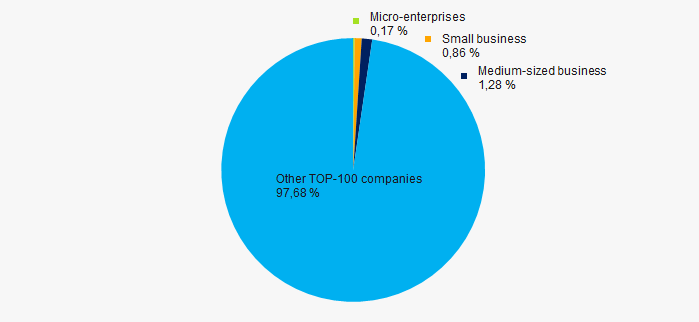 Picture 10. Shares of small and medium-sized enterprises in TOP-100, %
Main regions of activity
Companies of TOP-1000 are registered in 35 regions of Russia and located across the country quite unequally, taking into account the geographical location of raw material sources. Over 58% of their turnover is concentrated in Krasnodar territory, Voronezh, Lipetsk and Tambov regions (Picture 11).
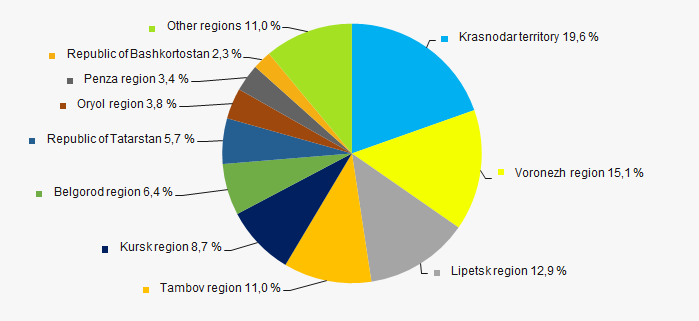 Picture 11. Distribution of TOP-100 revenue by regions of Russia
Financial position score
Assessment of the financial position of TOP-100 companies shows that the majority of them have stable financial position (Picture 12).
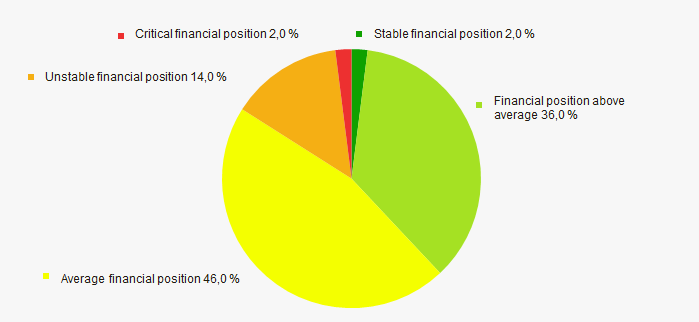 Picture 12. Distribution of TOP-100 companies by financial position score
Solvency index Globas
Most of TOP-100 companies got Superior / High and Strong / Medium index Globas. This fact shows their ability to meet their obligations fully (Picture 13).
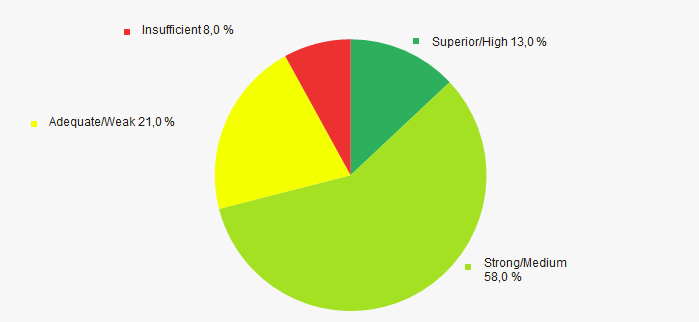 Picture 13. Distribution of TOP-100 companies by solvency index Globas
Conclusion
Complex assessment of activity of the largest Russian companies engaged in sugar production, taking into account the main indexes, financial ratios and indicators, demonstrates the prevalence of positive trends (Table 1).
| Trends and evaluation factors | Relative share of factors, % |
| Rate of growth (decline) in the average size of net assets |  10 10 |
| Increase / decrease in the share of enterprises with negative values of net assets |  -10 -10 |
| Rate of growth (decline) in the average size of revenue |  10 10 |
| Level of competition |  -5 -5 |
| Rate of growth (decline) in the average size of profit (loss) |  10 10 |
| Growth / decline in average values of companies’ net profit |  -10 -10 |
| Growth / decline in average values of companies’ net loss |  -10 -10 |
| Increase / decrease in average values of total liquidity ratio |  5 5 |
| Increase / decrease in average values of return on investment ratio |  -10 -10 |
| Increase / decrease in average values of asset turnover ratio, times |  10 10 |
| Share of small and medium-sized businesses in the region in terms of revenue being more than 22% |  -10 -10 |
| Regional concentration |  5 5 |
| Financial position (the largest share) |  5 5 |
| Solvency index Globas (the largest share) |  10 10 |
| Average value of relative share of factors |  0,7 0,7 |
 positive trend (factor) ,
  negative trend (factor).