
Order a report
Custom-made industry research, company ratings, competitor analysis


Return on investments of Russian largest enterprises on drilling related to oil and gas extraction
Information agency Credinform has prepared the ranking of the Russian largest enterprises on drilling related to oil and gas extraction on return on investments ratio.
The largest by revenue enterprises in this industry in Russia (TOP-10) for the last available in the Statistical register period (2015) were taken for the ranking. Further the enterprises were ranked in the descending order of return on investments ratio. (Table 1).
Return on investments (%) is calculated as a ratio of net profit (loss) to net assets value. The indicator characterizes a yield from each ruble, received from investments, i.e. the number of monetary units required by an enterprise for receiving one monetary unit of net profit.
In order to get the full and fair picture of company’s financial situation, it’s necessary to pay attention not only to the level of return on investments, but also to all the available combination of its financial data and ratios.
| Name | Net profit 2015, mln RUB | Revenue 2015, mln RUB | Revenue 2015 to 2014, % | Return on investments 2014 % | Return on investments 2015 % | Solvency index Globas-i |
|---|---|---|---|---|---|---|
| ERIELL NEFTEGAZSERVICE LLC Tax number 7727650928 Moscow |
950,0 | 22 012,9 | 77 | 391,93 | 146,96 | 550 Insufficient |
| JSC SIBERIAN SERVICES COMPANY Tax number 814118403 Moscow |
1 696,3 | 28 517,7 | 104 | 39,25 | 33,95 | 197 Prime |
| BKE Shelf Ltd Tax number 3008011426 Astrakhan region |
1 440,9 | 12 412,6 | 142 | 50,25 | 25,90 | 218 High |
| LLC TARGIN BURENIE Tax number 272016783 Republic of Bashkortostan |
722,1 | 8 946,0 | 107 | 19,35 | 23,08 | 245 High |
| LLC BUROVAYA KOMPANIYA EURASIA Tax number 8608049090 Moscow |
10 887,1 | 60 401,4 | 90 | 22,59 | 22,21 | 220 High |
| LLC SGC - DRILLING Tax number 1326182132 Moscow |
1 802,1 | 12 653,8 | 90 | 15,27 | 18,70 | 208 High |
| LLC INTEGRA – DRILLING Tax number 1834039053 Tyumen region |
232,5 | 5 728,1 | 80 | -15,93 | 5,79 | 550 Insufficient |
| LLC NOVA ENERGY SERVICES LIMITED Tax number 8911019233 Yamalo-Nenets autonomous district |
14,4 | 8 485,0 | 90 | 2,79 | 0,98 | 288 High |
| LLC RN-BURENIE Tax number 7706613770 Moscow |
58,0 | 29 544,3 | 86 | 3,32 | 0,21 | 307 Satisfactory |
| LLC BVS EURASIA Tax number 8608055801 Khanty-Mansiisk autonomous district |
-729,1 | 5 308,8 | 74 | -154,28 | -401,85 | 337 Satisfactory |
LLC BUROVAYA KOMPANIYA EURASIA took the fifth place of the ranking, having the largest revenue for 2015. The company’s share in the total revenue volume of the TOP-10 amounted to 31%. Furthermore it has the largest profit indicator among the TOP-10 companies.
ERIELL NEFTEGAZSERVICE LLC shows the largest return on investments. However this indicator decreased by 2,5 times in comparison with the previous accounting period. Besides, the company was given the insufficient solvency index Globas-i, due to information about being a defendant in debt collection arbitration proceedings and claims filed against the company for recognition bankrupt (insolvent). For these reasons the same solvency index Globas-i was given to LLC INTEGRA – DRILLING.
LLC RN-BURENIE and LLC BVS EURASIA were given satisfactory solvency indices Globas-i, due to being a defendant in debt collection arbitration proceedings. Moreover, LLC BVS EURASIA is the only company out of the TOP-10, having the net loss and correspondingly the negative value of return on investments for 2014 and 2015.
The rest six companies were given the prime and high solvency index Globas-i, which gives evidence to their ability to meet the debt obligations timely and in full.
The industry-average value amounted to 11,97% in 2013 and decreased to 6,89% in 2014. The corresponding trend of return on investments decrease is also observed in the group of companies TOP-10, where the indicator of the seven companies has worsened.
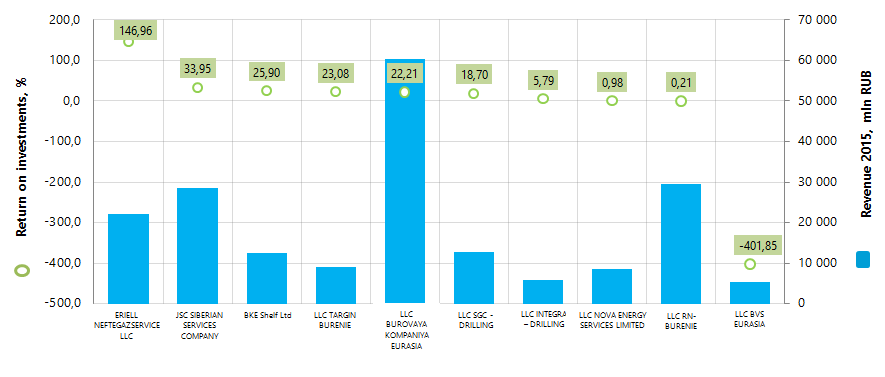
The total revenue volume of the TOP-10 for 2015 amounted to 194 billion RUB, which is by 9% lower than the indicator for 2014. At the same time the net profit of these companies increased by 55% for the same period.
In the whole, the industry closely related to energy sources extraction, faces certain difficulties, generated by the known events both in the world energy sources market, and in geopolitical sphere.
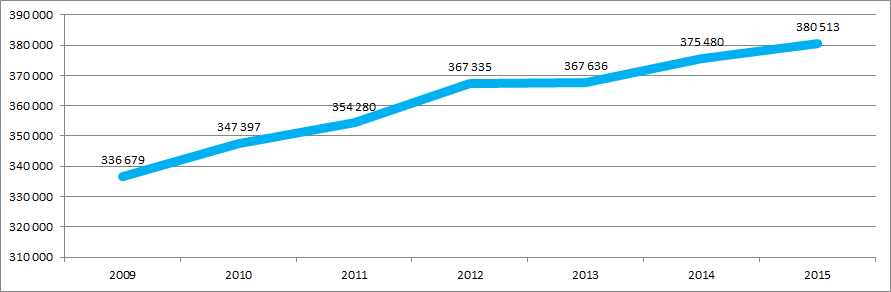
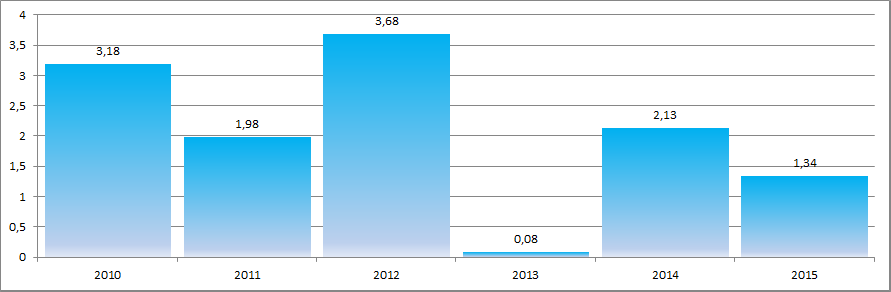
The data of the Federal State Statistics Service gives evidence on the one hand to constant growth of the number of wells in the absolute value (Figure 2), on the other – growth rates from year to year don’t show stability (Figure 3).
Owing to specific manufacturing features, the enterprises on drilling related to oil and gas extraction gravitate either to the largest financial center of the country – Moscow, or to regions where it is possible to locate the cost-effective production facility. The data of the Information and Analytical system Globas-i on registration of 100 industry largest by the revenue volume companies gives evidence to it. TOP-7 regions:
| Region | Number of companies |
|---|---|
| Khanty-Mansiisk autonomous district | 22 |
| Moscow | 14 |
| Republic of Bashkortostan | 11 |
| Republic of Tatarstan | 6 |
| Tyumen region | 6 |
| Yamalo-Nenets autonomous district | 6 |
| Samara region | 5 |