
Order a report
Custom-made industry research, company ratings, competitor analysis


Debt to assets ratio of small wholesale companies
Information agency Credinform has prepared a ranking of Russian small companies in wholesale trade. Russian small companies that are wholesalers and are included in the Register of small and medium-sized enterprises of the Federal Tax Service, and have the largest annual revenue (TOP-10) were selected for the ranking, according to the data from the Statistical Register for the latest available accounting periods (2015 - 2017). Then they were ranked by debt to assets ratio (Table 1). The analysis was based on the data from the Information and Analytical system Globas.
Debt to assets ratio indicates the share of the company’s assets being financed by loans. Normal value of the ratio is from 0.2 to 0.5.
Sales revenue and net profit demonstrate a company’s size and its business efficiency, and debt to solvency ratio indicates the risk of insolvency. It is particularly important to consider the structure of liabilities: both current and non-current. Long-term projects are not to be financed by short-term loans that are due less than in 12 months. Unforeseen conditions may have a great impact on a company’s solvency.
In 2017, almost two-thirds of the companies had a debt to assets ratio that is above the average industry one. It characterizes the wholesale industry as a one that is more dependent on external funds.
The indicators and financial ratios under consideration, as well as their change, are to be considered to get a full and comprehensive vision of the financial standing of the sector companies. See the TOP-10 companies ranking below (Table 1).
| Name, INN, region | Sales revenue, billion RUB | Net profit (loss), million RUB | Debt to assets ratio | Solvency index Globas | |||
| 2016 | 2017 | 2016 | 2017 | 2016 | 2017 | ||
| 1 | 2 | 3 | 4 | 5 | 6 | 7 | 8 |
| SIBSULPHUR CO.,LTD. INN 2466127447 Krasnoyarsk territory |
|
|
|
|
|
|
236 Strong |
| ORIMI TRADE LIMITED INN 7804069580 Leningrad region |
|
|
|
|
|
|
196 Наивысший |
| EAST TRADE LLC INN 3802011429 Irkutsk region |
|
|
|
|
|
|
252 Medium |
| TRADE HOUSE AGRO-LINE LLC INN 4706015503 Saint Petersburg |
|
|
|
|
|
|
201 Strong |
| PRODUCT MOSAIC LLC INN 6319152954 Samara region |
|
|
|
|
|
|
246 Strong |
| AGROALYANS LLC INN 6319712412 Samara region |
|
|
|
|
|
|
267 Medium |
| TRADE HOUSE GLOBAL MARKET LLC INN 9721073146 Moscow |
|
|
|
|
|
|
291 Medium |
| CHEESE MASTER LLC INN 6319179280 Samara region |
|
|
|
|
|
|
275 Medium |
| VELES GROUP LLC INN 7730550987 Moscow |
|
|
|
|
|
|
249 Strong |
| FORDA LLC INN 7814720226 Saint Petersburg |
|
|
|
|
|
|
257 Medium |
| Total for TOP-10 companies | |
|
|
|
|||
| Average value for TOP-10 companies | |
|
|
|
|
|
|
| Industry average value | |
|
|
|
|
|
|
![]() — improvement compared to prior period,
— improvement compared to prior period, ![]() — decline compared to prior period.
— decline compared to prior period.
In 2017 seven of TOP-10 companies improved their sales revenue, and seven companies had a higher net profit. Average sales revenue of TOP-10 companies declined, and debt to assets ratio stayed the same.
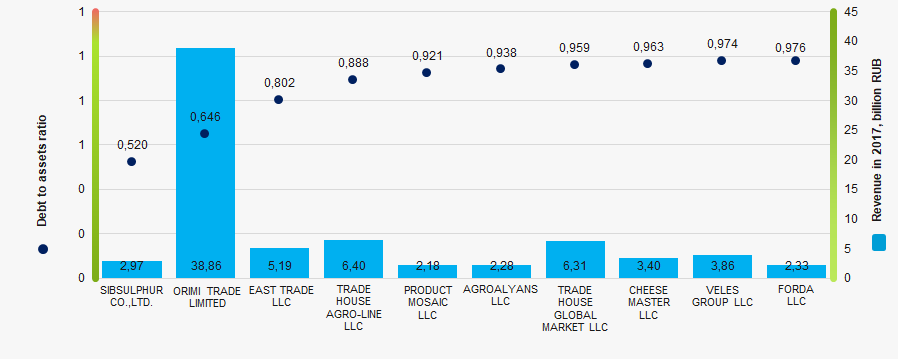 Picture 1. Debt to assets ratio and revenue of the largest Russian small wholesale companies (TOP-10)
In 2017 43% of total industry revenue belonged to the companies from the Central Federal District (Picture 2). Moscow and St. Petersburg have 26.2 and 11.4% of total revenue respectively. Moscow is also leading at assets and liabilities volume that are 29.6 and 28.9% respectively. TOP-5 regions by revenue of small companies in wholesale trade are Moscow, St. Petersburg, Moscow region, Leningrad region and Novosibirsk region. The same is regarding debt to assets ratio. This indicates that central regions of Russia are attractive for small businesses.
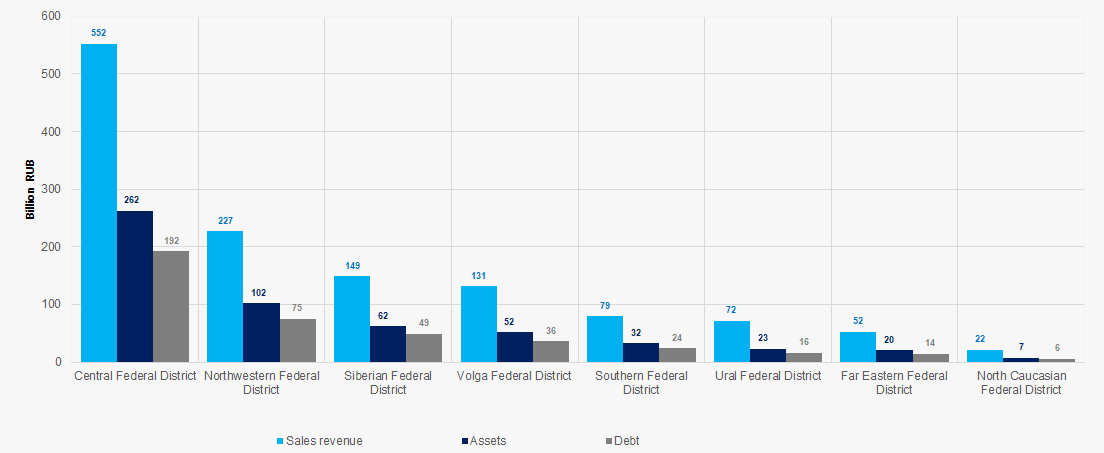 Picture 2. Regions by their share in total revenue of 2017
During the decade average debt to assets ratio clearly tends to grow (Picture 3). The growth peaked in 2014. The last 3 years showed a gradual decline in debt to assets ratio. In general, the sector needs time to get to the same level as 8 years ago.
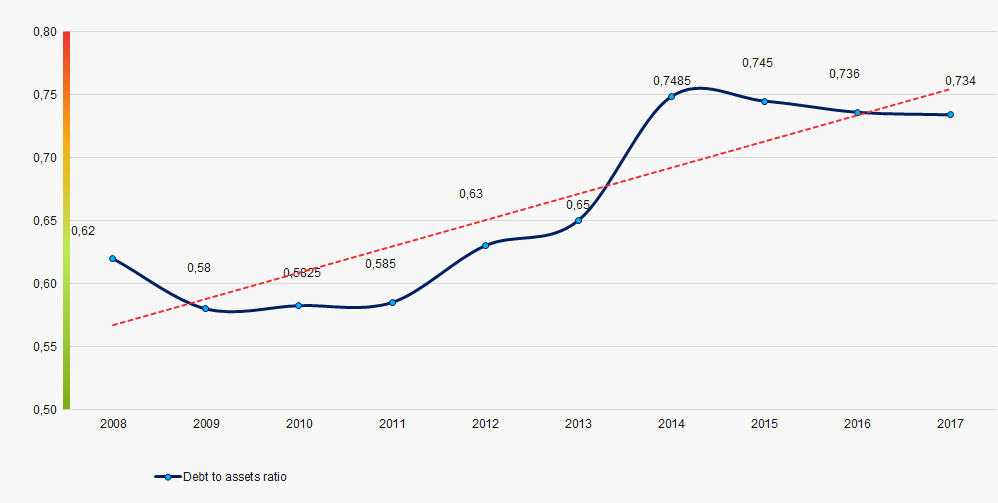 Picture 3. Change of average industry values of debt to assets ratio in 2008 – 2017