Trends in Moscow’s real economy
Information agency Credinform has prepared a review of activity trends of the largest companies of the Moscow’s real economy.
The largest companies (ТОP-10000) in terms of annual revenue were selected according to the data from the Statistical Register for the latest available periods (2013 - 2018). The analysis was based on data of the Information and Analytical system Globas.
Net assets is a ratio reflecting the real value of company's property. It is calculated annually as the difference between assets on the enterprise balance and its debt obligations. The ratio is considered negative (insufficiency of property), if company’s debt exceeds the value of its property.
The largest company in terms of net assets is JSC GAZPROM, INN 7736050003. In 2018 net assets of the company amounted to 11067 billion RUB.
The smallest size of net assets in ТОP-10000 had Otkritie Holding JSC, INN 7708730590. The lack of property of the company in 2018 was expressed in negative terms -454 billion RUB.
For the last five years, the average values of net assets showed the growing tendency (Picture 1).
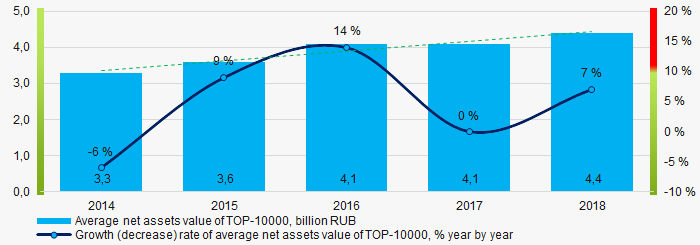 Picture 1. Change in TOP-10000 average net assets value in 2014 – 2018
For the last five years, the share of ТОP-10000 enterprises with lack of property showed the decreasing tendency (Picture 2).
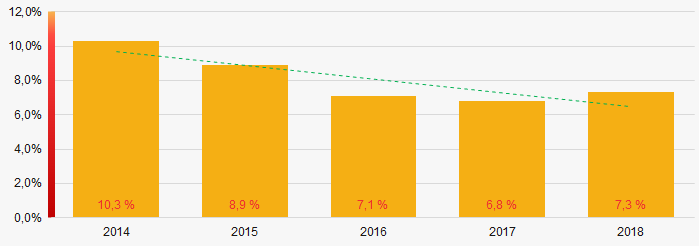 Picture 2. The share of enterprises with negative net assets value in ТОP-10000
Sales revenue
In 2018, the total revenue of 1000 largest companies amounted to more than 83% from ТОP-10000 total revenue. (Picture 3).This fact testifies the high level of capital concentration.
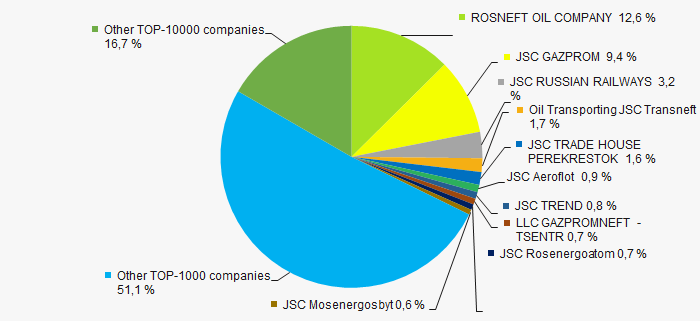 Picture 3. Shares of TOP-10 and TOP-1000 in TOP-10000 total revenue for 2018
In general, the growing trend in sales revenue is observed (Picture 4).
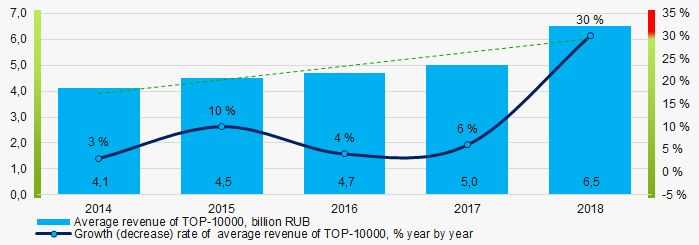 Picture 4. Change in average revenue of TOP-10000 in 2014 – 2018
Profit and loss
The largest company in terms of net profit is also JSC GAZPROM, INN 7736050003. In 2018, the company’s profit amounted to 933 billion RUB.
For the last five years, the profit values of ТОP-10000 companies showed the increasing tendency (Picture 5).
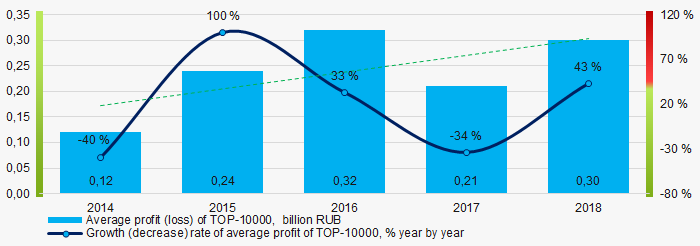 Picture 5. Change in average profit (loss) of TOP-10000 in 2014 – 2018
Over a five-year period, the average net profit values of ТОP-10000 show the increasing tendency, along with this the average net loss is increasing too (Picture 6).
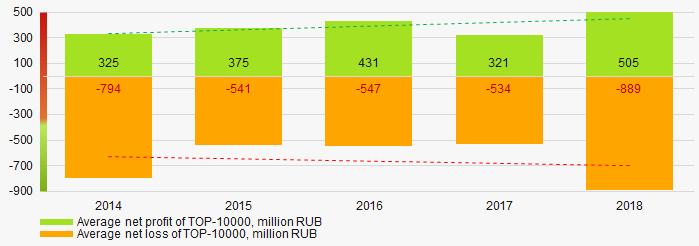 Picture 6. Change in average net profit/loss of ТОP-10000 companies in 2014 – 2018
Main financial ratios
For the last five years, the average values of the current liquidity ratio were higher than the recommended values - from 1,0 to 2,0, with increasing tendency (Picture 7).
The current liquidity ratio (ratio of total working capital to short-term liabilities) shows the sufficiency of company’s assets to meet short-term obligations.
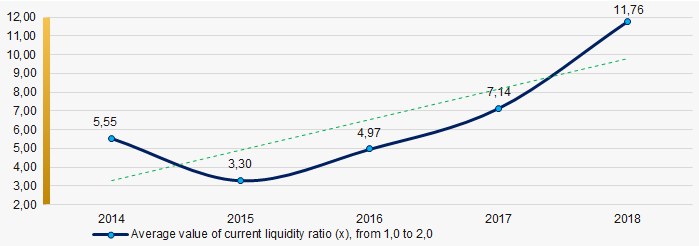 Picture 7. Change in average values of current liquidity ratio in 2014 – 2018
For the last five years, the growing tendency of ROI ratio is observed (Picture 8).
The ROI ratio is calculated as a ratio of net profit to sum of stockholder equity and long-term liabilities and shows the return from equity involved in commercial activities and long-term borrowed funds.
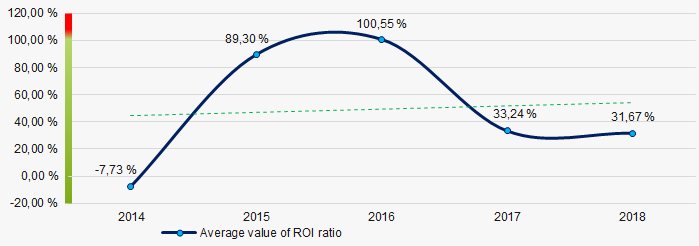 Picture 8. Change in average values of ROI ratio in 2014 – 2018
Assets turnover ratio is the ratio of sales revenue and company’s average total assets for a period. It characterizes the effectiveness of using of all available resources, regardless the source of their attraction. The ratio shows how many times per year the full cycle of production and circulation is performed, generating the corresponding effect in the form of profit.
For the last five years, this business activity ratio demonstrated the downward trend (Picture 9).
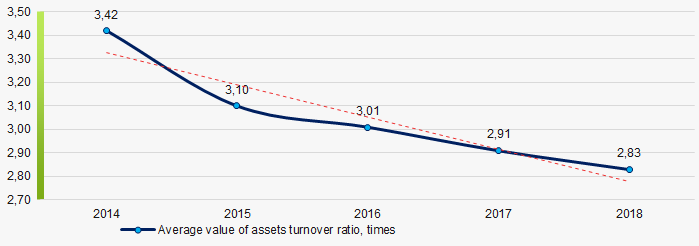 Picture 9. Change in average values of assets turnover ratio in 2014 – 2018
 Small businesses
51% of ТОP-10000 companies are registered in the Unified register of small and medium-sized enterprises of the Russian Federal Tax Service. Herein, their share in TOP-10000 total revenue amounted to 5,4%, which is significantly lower than national average value (Picture 10).
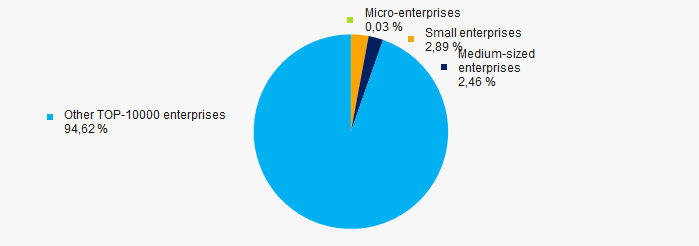 Picture 10. Shares of small and medium-sized enterprises in ТОP-10000
Main regions of activity
The wholesale companies have the largest share (almost 31%) in ТОP-10000 total revenue (Picture 11).
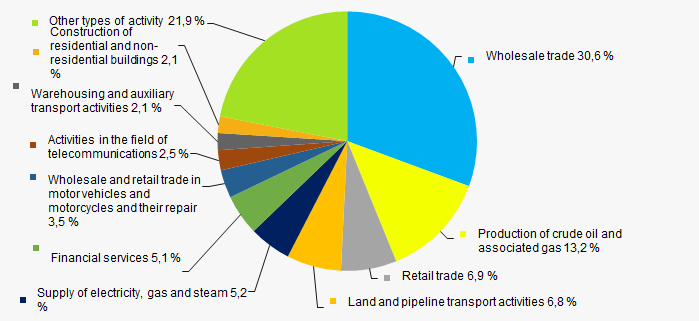 Picture 11. Distribution of TOP-10000 revenue by types of activity
Financial position score
An assessment of the financial position of TOP-10000 companies shows that the largest part have the above average financial position (Picture 12).
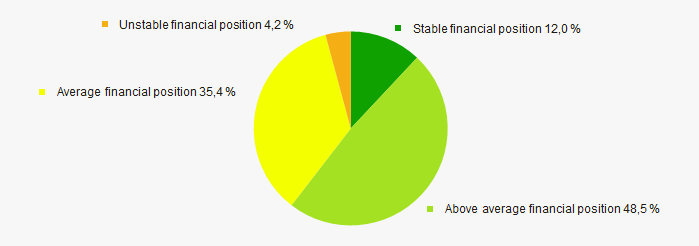 Picture 12. Distribution of TOP-10000 companies by financial position score
Solvency index Globas
Most of TOP-10000 companies got superior/high or strong/medium Solvency index Globas, this fact shows the ability of the companies to meet their obligations in time and fully (Picture 13).
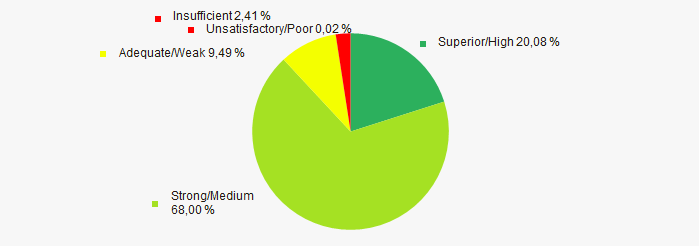 Picture 13. Distribution of TOP-10000 companies by Solvency index Globas
Industrial production index
According to the Federal Service of State Statistics, the growing tendency of industrial production index is observed in Moscow during 12 months of 2018 – 2019 (Picture 14). Herewith the average index from month to month amounted to 101,2%.
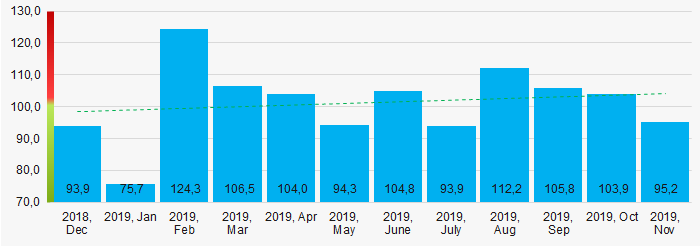 Picture 14. Industrial production index in Moscow in 2018-2019, month by month (%)
According to the same data, the share of Moscow enterprises in total revenue from sale of goods, products, works and services within country amounted to 25,083% in 2018 and 24,959% for 9 months of 2019, which is higher than the figure for the same period in 2018 (24.780%).
Conclusion
A complex assessment of the largest companies of the Moscow’s real economy, taking into account the main indexes, financial ratios and indicators, demonstrates the presence of positive trends (Table 1).
| Trends and assessment factors | Relative share, % |
| Growth/drawdown rate of average net assets value |  10 10 |
| Increase / decrease in the share of enterprises with negative net assets |  10 10 |
| The level of competition / monopolization |  -10 -10 |
| Growth/drawdown rate of average revenue |  10 10 |
| Growth/drawdown rate of average net profit (loss) |  10 10 |
| Increase / decrease in average net profit |  10 10 |
| Increase / decrease in average net loss |  -10 -10 |
| Increase / decrease in average values of current liquidity ratio |  5 5 |
| Increase / decrease in average values of ROI ratio |  10 10 |
| Increase / decrease in average values of assets turnover ratio, times |  -10 -10 |
| Share of small and medium-sized businesses by revenue more than 22% |  -10 -10 |
| Financial position (the largest share) |  10 10 |
| Solvency index Globas (the largest share) |  10 10 |
| Industrial production index |  10 10 |
| Dynamics of the share of the region's revenue in the total revenue of the Russian Federation |  5 5 |
| Average value of factors |  4,0 4,0 |
 favorable trend (factor),
  unfavorable trend (factor).
TOP regions of Russia by economic opportunities
Regional budgets for 2020 and the planning period 2021-2022 were adopted in all the subjects of the Russian Federation. The budget of each region consists of incomes and expenditures. The income budget is formed by taxes, as well as inter-budget transfers. The expenditure budget consists of revenues and sources of financing the deficit when expenses exceed revenues.
The expenditure side of the budget is of particular interest, since the amount of financing of transport infrastructure, social security, education, healthcare, etc. depends on its volume.
The economic opportunities of each region are different. Commodity regions and capitals have better position. Moscow leads among all the territories of Russia in terms of funding: the budget expenditures in 2020 will be a record 3,150 billion RUB, having increased by 15% in comparison with the 2019 budget (see Table 1).
Large amounts of funding bring results. Moscow is noticeably transforming: transport, the urban environment, and road infrastructure are booming. The main source of financial well-being of the capital is taxes: 41% of the total income is generated by personal income tax (PIT), and another 35% comes from corporate income tax.
Saint Petersburg is the second by budget expenditure. In 2020, it is planned to spend 728 billion RUB, which is by 9% more than in 2019.
The Jewish Autonomous Region has the lowest expenditure budget among 85 subjects: 11,8 billion RUB, which is 267 times less than in Moscow.
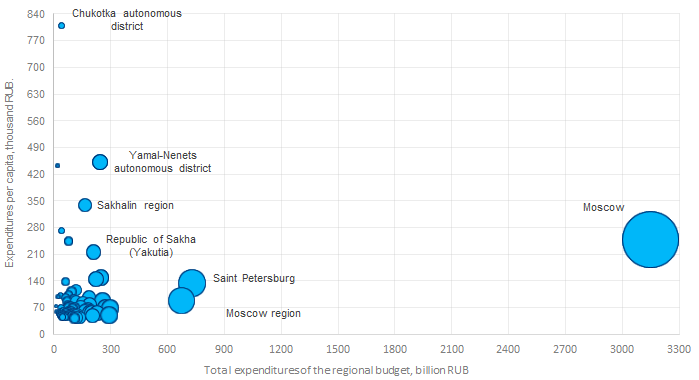 Picture 1. Total amount of expenditures of regional budgets for 2020, and budget expenditures per capita. The size of the circle corresponds to the value of the expenditure budget
Saint Petersburg’s budget is 4,3 times lower than the Moscow’s one. Based on a different population size, it is more correct to compare the economic opportunities of each region by dividing the expenditure budget by the number of inhabitants: budget expenditures per capita in Moscow in 2020 will amount to 250 thousand RUB per capita, and it will amount to 135 thousand RUB per capita in Saint Petersburg. Thus, it will be spent 1,9 times more per capita in Moscow than in St. Petersburg.
In Chukotka autonomous district, budget expenditures per capita increased to 810 thousand rubles, which is the countrywide maximum. The minimum indicator of 44 thousand RUB is recorded in Volgograd region, and it is 18 times less than that of the leader.
The numbers show that the problem of regional inequality persists. At the same time, with the exception of several leading regions, most of the territories have comparable economic opportunities. This is shown in the Table 1: budget expenditures is recorded up to 300 billion RUB for almost all subjects of Russia, and the volume of budget expenditures per capita is up to 140 thousand RUB.
| Rank | Subject of Russia | Budget expenditures, billion RUB | Per capita, thousand RUB |
| 1 | Moscow | 3150,0 | 250 |
| 2 | Saint Petersburg | 727,7 | 135 |
| 3 | Moscow region | 673,3 | 89 |
| 4 | Sverdlovsk region | 296,6 | 69 |
| 5 | Krasnodar territory | 292,8 | 52 |
| 6 | Republic of Tatarstan | 273,2 | 70 |
| 7 | Krasnoyarsk territory | 254,6 | 89 |
| 8 | Khanty-Mansi autonomous district-Yugra | 249,0 | 150 |
| 9 | Yamal-Nenets autonomous district | 244,5 | 452 |
| 10 | Republic of Bashkortostan | 226,6 | 56 |
| 11 | Tyumen region | 221,6 | 146 |
| 12 | Republic of Sakha (Yakutia) | 208,4 | 216 |
| 13 | Rostov region | 204,1 | 49 |
| 14 | Chelyabinsk region | 200,8 | 58 |
| 15 | Nizhniy Novgorod region | 194,6 | 61 |
| 16 | Irkutsk region | 188,9 | 79 |
| 17 | Republic of Crimea | 185,2 | 97 |
| 18 | Samara region | 184,8 | 58 |
| 19 | Novosibirsk region | 181,7 | 65 |
| 20 | Kemerovo region - Kuzbass | 171,3 | 64 |
| 21 | Sakhalin region | 166,3 | 340 |
| 22 | Perm territory | 163,5 | 63 |
| 23 | Leningrad region | 154,1 | 83 |
| 24 | Primorye territory | 141,6 | 74 |
| 25 | Republic of Dagestan | 138,6 | 45 |
| 26 | Voronezh region | 124,2 | 53 |
| 27 | Stavropol territory | 123,8 | 44 |
| 28 | Altai territory | 118,1 | 51 |
| 29 | Kaliningrad region | 116,5 | 116 |
| 30 | Khabarovsk territory | 115,4 | 87 |
| 31 | Saratov region | 111,4 | 46 |
| 32 | Volgograd region | 108,7 | 43 |
| 33 | Belgorod region | 107,9 | 70 |
| 34 | Orenburg region | 106,2 | 54 |
| 35 | Arkhangelsk region | 101,5 | 92 |
| 36 | Chechen Republic | 99,0 | 68 |
| 37 | Republic of Komi | 93,4 | 113 |
| 38 | Omsk region | 92,7 | 48 |
| 39 | Tula region | 90,5 | 61 |
| 40 | Vologda region | 86,8 | 74 |
| 41 | Tomsk region | 81,0 | 75 |
| 42 | Yaroslavl region | 77,9 | 62 |
| 43 | Republic of Udmurtia | 77,6 | 52 |
| 44 | Kamchatka territory | 77,0 | 245 |
| 45 | Murmansk region | 77,0 | 103 |
| 46 | Zabaikalye territory | 76,3 | 72 |
| 47 | Republic of Buryatia | 76,1 | 77 |
| 48 | Tver region | 75,8 | 60 |
| 49 | Kaluga region | 72,3 | 72 |
| 50 | Amur region | 69,4 | 88 |
| 51 | Lipetsk region | 69,2 | 60 |
| 52 | Vladimir region | 68,1 | 50 |
| 53 | Bryansk region | 67,6 | 56 |
| 54 | Kursk region | 63,9 | 58 |
| 55 | Ryazan region | 62,7 | 56 |
| 56 | Penza region | 62,4 | 47 |
| 57 | Sevastopol | 61,7 | 139 |
| 58 | Ulyanovsk region | 61,3 | 50 |
| 59 | Kirov region | 60,4 | 48 |
| 60 | Republic of Karelia | 60,3 | 98 |
| 61 | Republic of Chuvashia | 55,4 | 45 |
| 62 | Smolensk region | 50,9 | 54 |
| 63 | Astrakhan region | 50,8 | 50 |
| 64 | Kurgan region | 50,2 | 60 |
| 65 | Tambov region | 50,1 | 49 |
| 66 | Ivanovo region | 45,3 | 45 |
| 67 | Republic of Mordovia | 40,8 | 51 |
| 68 | Chukotka autonomous district | 40,3 | 881 |
| 69 | Republic of Kabardino-Balkaria | 39,4 | 45 |
| 70 | Magadan region | 38,6 | 273 |
| 71 | Pskov region | 38,3 | 61 |
| 72 | Republic of Khakassia | 37,7 | 70 |
| 73 | Novgorod region | 36,6 | 61 |
| 74 | Oryol region | 36,3 | 49 |
| 75 | Republic of Mari El | 35,4 | 52 |
| 76 | Kostroma region | 34,8 | 55 |
| 77 | Republic of North Ossetia-Alania | 34,0 | 49 |
| 78 | Republic of Tyva | 33,3 | 103 |
| 79 | Republic of Ingushetia | 28,6 | 57 |
| 80 | Republic of Karachay-Cherkessia | 26,2 | 56 |
| 81 | Republic of Adygea | 25,6 | 56 |
| 82 | Republic of Altai | 21,7 | 99 |
| 83 | Nenets autonomous district | 19,4 | 443 |
| 84 | Republic of Kalmykia | 16,3 | 60 |
| 85 | Jewish autonomous district | 11,8 | 74 |