
Order a report
Custom-made industry research, company ratings, competitor analysis


Trends in hotel industry
Information agency Credinform presents a review of the activity trends of the small enterprises of the hotel industry.
The largest hotel industry enterprises (TOP-1000), registered in the Register of small and medium-sized enterprises of the Federal Tax Service of the Russian Federation, in terms of annual revenue were selected for the analysis according to the data from the Statistical Register and the Federal Tax Service for the latest available accounting periods (2016 – 2020). The selection of companies and the analysis were based on the data from the Information and Analytical system Globas.
Net assets are total assets less total liabilities. This indicator reflects the real value of the property of an enterprise. When the company’s debt exceeds the value of its property, the indicator is considered negative (insufficiency of property).
The largest TOP-1000 company in terms of net assets is AO MBIK, INN 7840004758, Saint Petersburg. In 2020, net assets value amounted to almost 3,4 billion RUB.
The lowest net assets value among TOP-1000 was recorded for OOO VEGA, INN 7826138206, Saint Petersburg. In 2020, insufficiency of property was indicated in negative value of -2,2 billion RUB.
During five-year period, the average net assets values of TOP-1000 have a trend to increase with the decreasing growth rates (Picture 1).
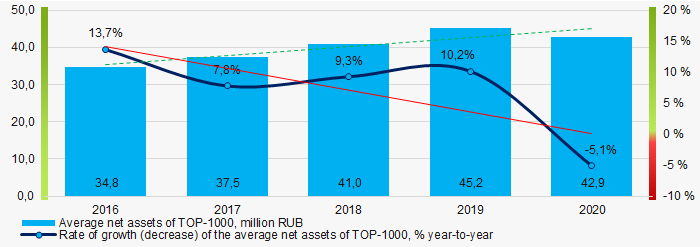 Picture 1. Change in average net assets value in TOP-1000 in 2016 - 2020
The shares of TOP-1000 enterprises with insufficient property had positive trend to decrease during last 5 years (Picture 2).
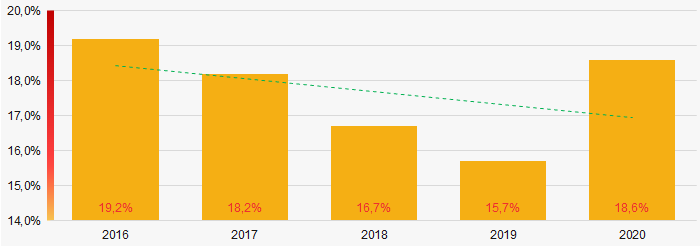 Picture 2. Shares of TOP-1000 companies with negative net assets values in 2016 - 2019
Sales revenue
The revenue volume of the ten leading companies amounted to almost 10% of the total revenue of TOP-1000 companies in 2020 (Picture 3). It gives evidence to high level of the competition in the hotel industry.
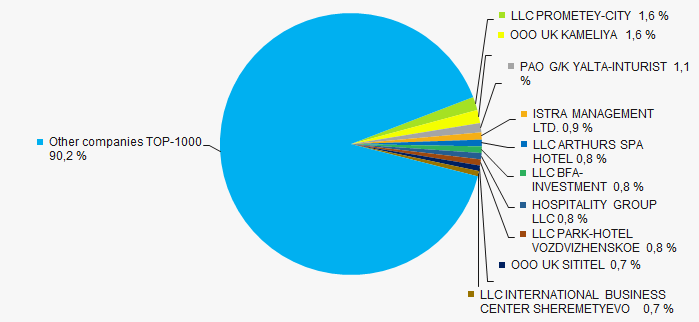 Picture 3. Shares of TOP-10 companies in the total revenue of TOP-1000 in 2020
 In general, there is a trend to decrease in revenue with declining of growth rates to negative values in 2019-2020 (Picture 4).
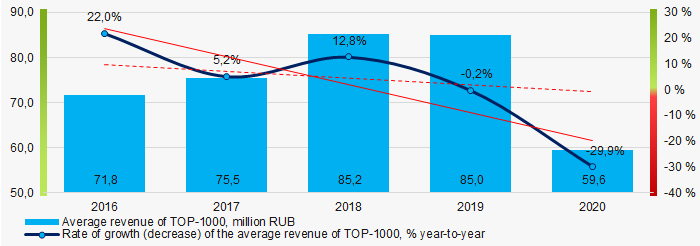 Picture 4. Change in average revenue of TOP-1000 in 2016 – 2020
Profit and lossstrong>
The largest TOP-1000 company in term of net profit is AO GOSTINITSA TURIST, INN 7717600910, Moscow, in process of being wound up since 23.09.2020. The company’s profit amounted to 706 billion RUB.
During five-year period, the average profit figures of TOP-1000 have a trend to decrease (Picture 5).
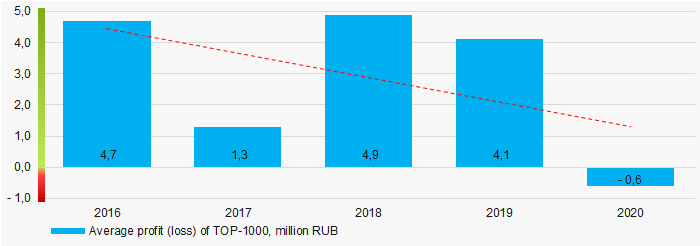 Picture 5. Change in average profit (loss) of TOP-1000 companies in 2016 - 2020
In the last five years, the average net profit figures of TOP-1000 companies have a trend to increase with the decreasing average net loss (Picture 6).
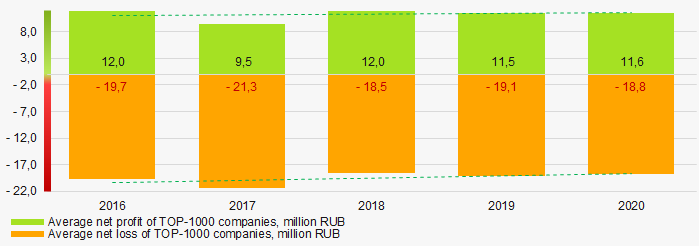 Picture 6. Change in average net profit and net loss of ТОP-1000 companies in 2016 – 2020
Key financial ratios
During five-year period, the average values of the current liquidity ratio of TOP-1000 companies were above the recommended one – from 1,0 to 2,0, with a trend to decrease. (Picture 7).
Current liquidity ratio (current assets to short-term liabilities) shows the sufficiency of company’s assets to repay on short-term liabilities.
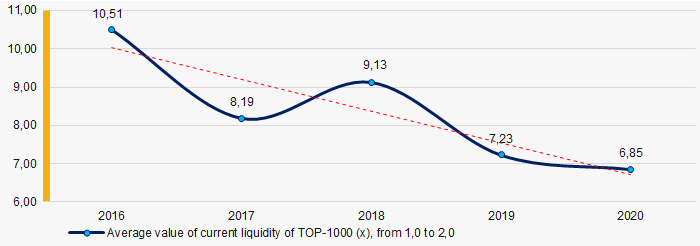 Picture 7. Change in average values of current liquidity ratio of TOP-1000 in 2016 – 2020
During five years, there was a trend to decrease in the average ROI values of TOP-1000 companies (Picture 8).
ROI ratio is calculated as net profit to sum of shareholders equity and long-term liabilities, and shows the return of equity involved in commercial activities and long-term borrowed funds.
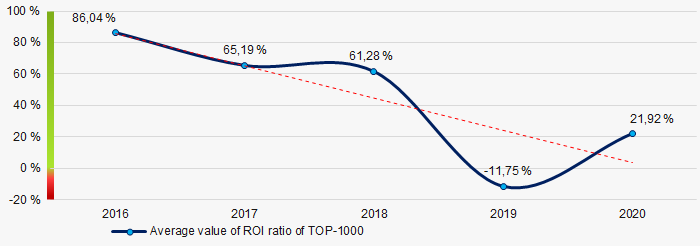 Picture 8. Change in average values of ROI ratio of TOP-1000 in 2016 – 2020
Assets turnover ratio is the ratio of sales revenue and company’s average total assets for a period. It characterizes the effectiveness of using of all available resources, regardless the source of their attraction. The ratio shows how many times per year the full cycle of production and circulation is performed, generating the corresponding effect in the form of profit.
During the five-year period, there was a trend to decrease of this ratio (Picture 9).
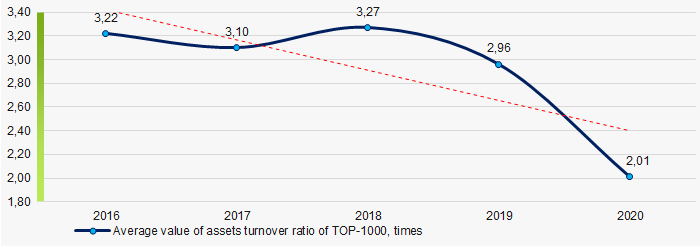 Picture 9. Change in average values of assets turnover ratio of TOP-1000 companies in 2016 – 2020
Small enterprises
Small enterprises have the major share in total revenue of TOP-1000 in 2020. (Picture 10).
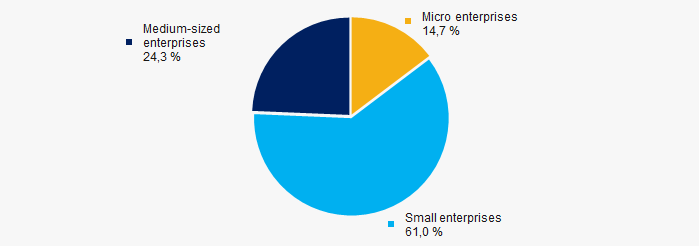 Picture 10. Shares of small and medium-sized enterprises in TOP-1000
Main regions of activity
Companies of TOP-1000 are registered in 81 regions of Russia, and unequally located across the country. Almost 33% of the TOP-1000 companies’ total revenue consolidate in Moscow, Saint Petersburg and Moscow region (Picture 11).
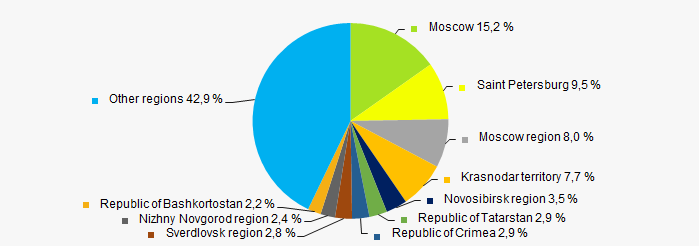 Picture 11. Distribution of TOP-1000 revenue by the regions of Russia
Financial position score
According to the assessment, the financial position of most of TOP-1000 companies is average (Picture 12).
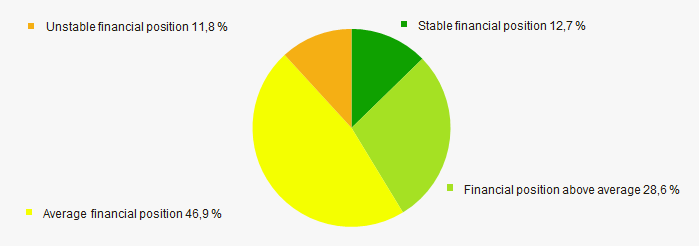 Picture 12. Distribution of TOP-1000 companies by financial position score
Solvency index Globas
Most of TOP-1000 companies got Superior / High and Strong / Medium index Globas. This fact shows their ability to meet their obligations fully and by the due date (Picture 13).
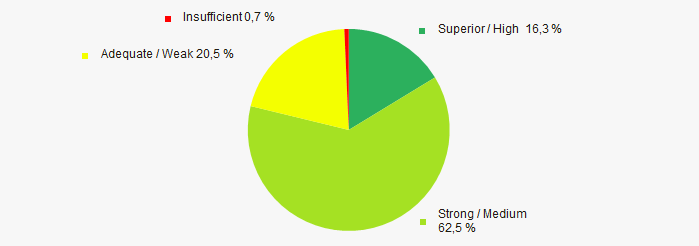 Picture 13. Distribution of TOP-1000 companies by solvency index Globas
Conclusion
Complex assessment of activity of the small enterprises of the hotel industry, taking into account the main indexes, financial ratios and indicators, demonstrates the prevalence of negative trends in their activity in 2016- 2020 (Table 1).
| Trends and evaluation factors | Relative share of factors, % |
| Dynamics of the average net assets value | |
| Rate of growth (decline) in the average size of net assets | |
| Increase / decrease in the share of enterprises with negative values of net assets | |
| Level of capital concentration | |
| Dynamics of the average revenue | |
| Rate of growth (decline) in the average size of revenue | |
| Dynamics of the average profit (loss) | |
| Growth / decline in average values of net profit | |
| Growth / decline in average values of net loss | |
| Increase / decrease in average values of current liquidity ratio | |
| Increase / decrease in average values of return on investment ratio | |
| Increase / decrease in average values of asset turnover ratio, times | |
| Regional concentration | |
| Financial position (the largest share) | |
| Solvency index Globas (the largest share) | |
| Average value of factors | |
![]() positive trend (factor),
positive trend (factor), ![]() negative trend (factor)
negative trend (factor)