
Order a report
Custom-made industry research, company ratings, competitor analysis


ТOP-1000 of Western Siberia companies
In order to reduce the interregional differences in the level and quality of life of the population, to accelerate economic growth and technological development and to ensure the national security of the country, in February 2019 the Russian Government approved the Strategy of Spatial Development of the Russian Federation until 2025. It consists of 12 macro-regions; one of them is West-Siberian region, which includes Altai Territory, Kemerovo region - Kuzbass, Novosibirsk, Omsk, Tomsk, Tyumen regions, Altai Republic, Khanty-Mansiysk Autonomous Region - Yugra and Yamalo-Nenets Autonomous District.
Information agency Credinform has prepared a review of activity trends of the largest companies of the real economy sector in the West-Siberian Region of Russia.
The largest companies (ТОP-1000) in terms of annual revenue were selected according to the data from the Statistical Register and the Federal Tax Service for the latest available periods (2014 - 2019). The analysis was based on data of the Information and Analytical system Globas.
Net assets is a ratio reflecting the real value of company's property. It is calculated annually as the difference between assets on the enterprise balance and its debt obligations. The ratio is considered negative (insufficiency of property), if company’s debt exceeds the value of its property.
The largest company in terms of net assets is JSC SURGUTNEFTEGAS, INN 8602060555, Khanty-Mansiysk Autonomous Region - Yugra. In 2019 net assets of the company amounted to 4305 billion RUB.
The smallest size of net assets in TOP-1000 had JSC ANTIPINSKY REFINERY, INN 7204084481, Tyumen region. The legal entity is declared insolvent (bankrupt) and bankruptcy proceedings are initiated, 04.01.2020. The lack of property of the company in 2019 was expressed in negative terms -223 billion RUB.
For the last six years, the average values of TOP-1000 net assets showed the growing tendency with negative dynamics of growth rates (Picture 1).
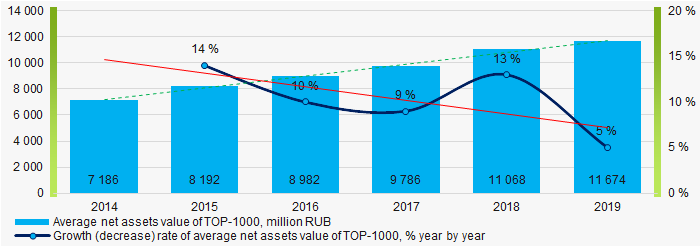 Picture 1. Change in average net assets value of ТОP-1000 companies in 2014 – 2019
For the last six years, the share of ТОP-1000 enterprises with lack of property is decreasing (Picture 2).
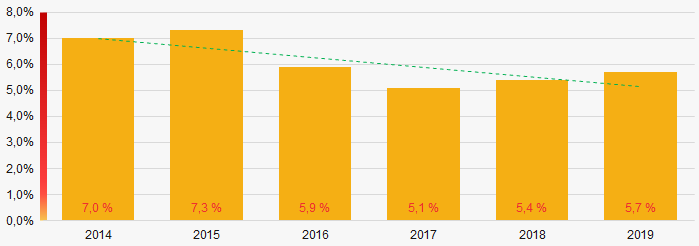 Picture 2. The share of enterprises with negative net assets value in ТОP-1000
Sales revenue
In 2019, the total revenue of the 10 largest companies amounted to 35% from ТОP-1000 total revenue (Picture 3). This fact testifies the high level of capital concentration.
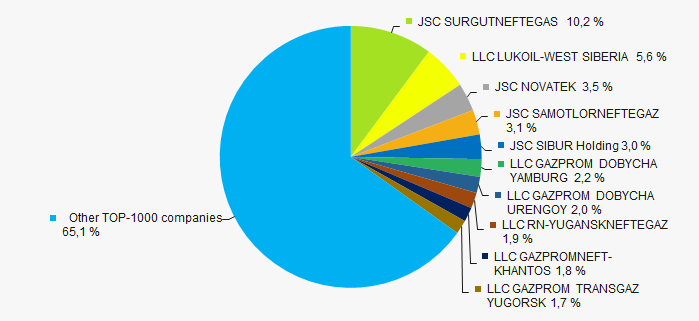 Picture 3. Shares of TOP-10 in TOP-1000 total revenue for 2019
In general, the growing trend in sales revenue with negative dynamics of growth rates is observed (Picture 4).
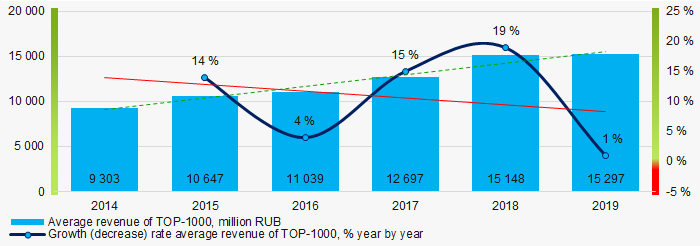 Picture 4. Change in average revenue of TOP-1000 in 2014 – 2019
Profit and loss
The largest company in terms of net profit is JSC YAMAL LNG, INN 7709602713, Yamalo-Nenets Autonomous District. In 2019, the company’s profit amounted to almost 252 billion RUB.
For the last six years, the average profit values of TOP-1000 show the growing tendency with positive dynamics of growth rates (Picture 5).
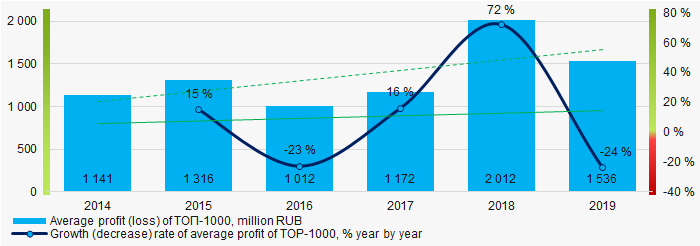 Picture 5. Change in average profit (loss) in 2014 – 2019
Over a six-year period, the average net profit values of ТОP-1000 show the growing tendency, along with this the average net loss is growing (Picture 6).
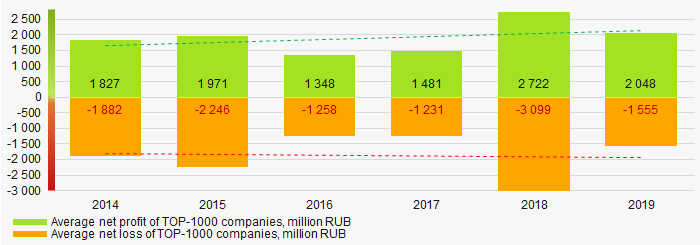 Picture 6. Change in average net profit/loss of ТОP-1000 companies in 2014 – 2019
Main financial ratios
For the last six years, the average values of the current liquidity ratio were higher than the recommended values - from 1,0 to 2,0, with growing trend (Picture 7).
The current liquidity ratio (ratio of total working capital to short-term liabilities) shows the sufficiency of company’s assets to meet short-term obligations.
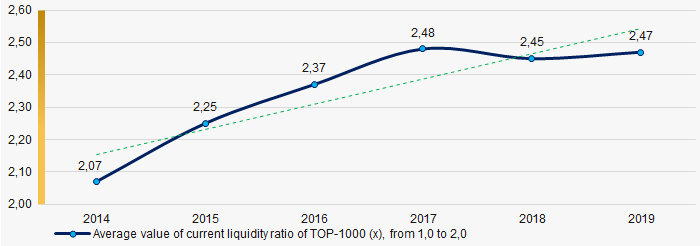 Picture 7. Change in average values of current liquidity ratio in 2014 – 2019
Within six years, the growing trend of the average values of ROI ratio is observed (Picture 8).
The ROI ratio is calculated as a ratio of net profit to sum of stockholder equity and long-term liabilities and shows the return from equity involved in commercial activities and long-term borrowed funds.
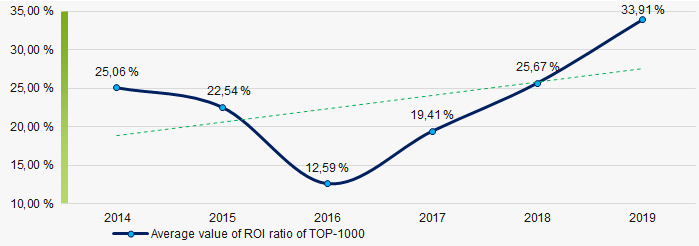 Picture 8. Change in average values of ROI ratio in 2014 – 2019
Assets turnover ratio is the ratio of sales revenue and company’s average total assets for a period. It characterizes the effectiveness of using of all available resources, regardless the source of their attraction. The ratio shows how many times per year the full cycle of production and circulation is performed, generating the corresponding effect in the form of profit.
For the last six years, this business activity ratio demonstrated the downward trend (Picture 9).
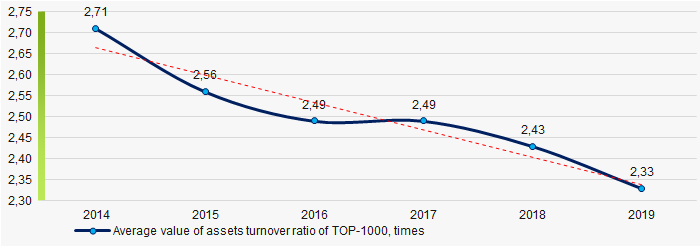 Picture 9. Change in average values of assets turnover ratio in 2014 – 2019
Small businesses
17% of ТОP-1000 companies are registered in the Unified register of small and medium-sized enterprises of the Russian Federal Tax Service. Herein, their share in TOP-1000 total revenue is only 1,5%, which is significantly lower than the national average value in 2018 – 2019 (Picture 10).
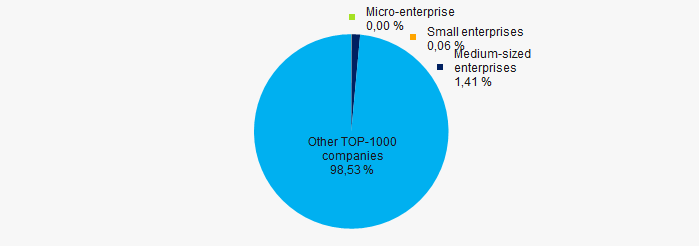 Picture 10. Shares of small and medium-sized enterprises in ТОP-1000
Main regions of activity
TOP-1000 companies are registered in 9 regions of Russia and are unequally located across the country. Almost 58% of the largest enterprises in terms of revenue are located in Khanty-Mansiysk Autonomous Region - Yugra and Yamalo-Nenets Autonomous District (Picture 11).
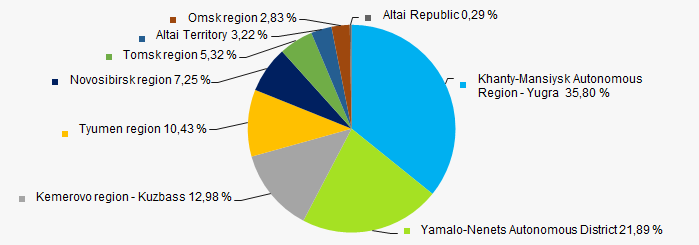 Picture 11. Distribution of TOP-1000 revenue by the territories of the West-Siberian Region of Russia
Financial position score
An assessment of the financial position of TOP-1000 companies shows that the half of the companies has above average financial position (Picture 12).
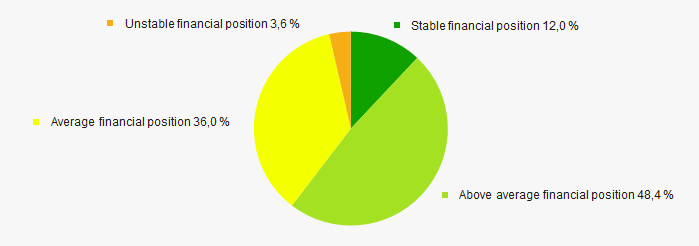 Picture 12. Distribution of TOP-1000 companies by financial position score
Solvency index Globas
Most of TOP-1000 companies got superior/high or strong/medium Solvency index Globas, this fact shows the ability of the companies to meet their obligations in time and fully (Picture 13).
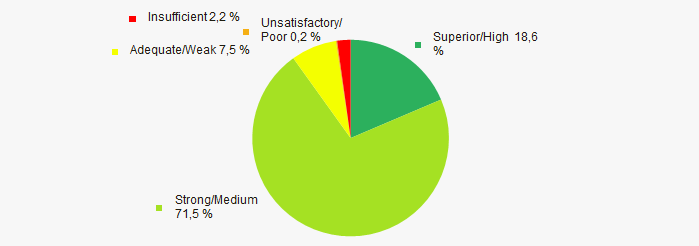 Picture 13. Distribution of TOP-1000 companies by Solvency index Globas
Industrial production index
According to the Federal Service of State Statistics, there is a downward trend in the industrial production index in the West-Siberian Region of Russia during 12 months of 2019 – 2020 (Picture 14). Herewith the average index from month to month amounted to 103%.
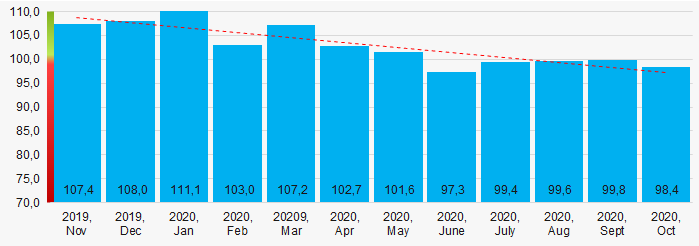 Picture 14. Average industrial production index in the West-Siberian Region of Russia in 2019-2020, month by month (%)
Conclusion
A complex assessment of activity of the largest companies of the real economy sector in the West-Siberian Region of Russia, taking into account the main indexes, financial ratios and indicators, demonstrates the presence of positive trends (Table 1).
| Trends and assessment factors | Relative share, % |
| Dynamics of average net assets value | |
| Growth/drawdown rate of average net assets value | |
| Increase / decrease in the share of enterprises with negative net assets | |
| The level of competition / monopolization | |
| Dynamics of average revenue | |
| Growth/drawdown rate of average profit | |
| Dynamics of average profit | |
| Growth/drawdown rate of average revenue | |
| Increase / decrease in average net profit of companies | |
| Increase / decrease in average net loss of companies | |
| Increase / decrease in average values of current liquidity ratio | |
| Increase / decrease in average values of ROI ratio | |
| Increase / decrease in average values of assets turnover ratio, times | |
| Share of small and medium-sized businesses by revenue more than 20% | |
| Regional concentration | |
| Financial position (the largest share) | |
| Solvency index Globas (the largest share) | |
| Industrial production index | |
| Average value of factors | |
![]() favorable trend (factor),
favorable trend (factor), ![]() unfavorable trend (factor).
unfavorable trend (factor).
TOP-10 of agricultural goods exported from Russia
For the last five years, the export of Russian agricultural goods has grown by almost one third: in 2014, the export value amounted to USD 19,8 billion and to USD 25,5 billion in 2019, which is significantly higher than the sales of domestic weapons for the same period – USD 15.2 billion.
Russia is the world's leading grain exporter (including wheat) for the fifth year in a row: in the 2019 agricultural year, the wheat shipments amounted to 33.2 million tons worth more than USD 6 billion. It is particularly remarkable that the USSR within the last years of its existence, on the contrary, was the net wheat importer. According to the 2020 preliminary results, the export of wheat may increase to another record - 40,8 million tons.
In addition to wheat, the following commodity groups accrue the monetary export volume of more than USD 1 billion per year: frozen fish, sunflower oil and crustaceans (Table 1).
| Rank | Commodity group | 2019 export, million USD |
| 1 | Wheat and meslin | 6 394 |
| 2 | Frozen fish | 2 498 |
| 3 | Sunflower oil | 2 121 |
| 4 | Crustaceans | 1 583 |
| 5 | Barley | 706 |
| 6 | Corn | 533 |
| 7 | Rape seed or mustard oil | 514 |
| 8 | Oilseed residues | 416 |
| 9 | Soya bean oil | 398 |
| 10 | Fish fillets | 392 |
Source: Federal customs service of Russia; Credinform analyses
China is the largest importer of domestic agricultural goods: in 2019, the shipments to China amounted to 3,2 billion USD. Taking into account the huge market, rapid urbanization and growing welfare of the Chinese citizens, our farmers should consider this direction as the most promising for sales.
| Rank | Country | 2019 export, million USD | Export share, % |
| 1 | China | 3 188 | 12,5 |
| 2 | Turkey | 2 489 | 9,8 |
| 3 | Kazakhstan | 1 851 | 7,3 |
| 4 | Republic of Korea | 1 555 | 6,1 |
| 5 | Egypt | 1 469 | 5,8 |
| 6 | Belarus | 1 378 | 5,4 |
| 7 | Netherlands | 989 | 3,9 |
| 8 | Iran | 962 | 3,8 |
| 9 | Ukraine | 708 | 2,8 |
| 10 | Azerbaijan | 619 | 2,4 |
| - | Other countries | 10 240 | 40,2 |
Source: Federal customs service of Russia; Credinform analyses
The current foreign trade dynamics gives reason to believe, that in the mid-term, Russia may become one of the world's top ten exporters of agricultural goods.