
Order a report
Custom-made industry research, company ratings, competitor analysis


Trends of the largest companies
Information agency Credinform has prepared a review of trends of the largest operating companies of 10 most populated regions of Russia. The largest enterprises (TOP-1000) in terms of annual revenue were selected for the analysis according to the data from the Statistical Register for the latest available periods (2012-2017). The analysis was based on the data of the Information and Analytical system Globas.
Net assets are total assets less total liabilities. This indicator reflects the real value of the property of an enterprise. When the company’ s debt exceeds the value of its property, the indicator is considered negative (insufficiency of property).
| №, name, INN, activity | Net assets value, bln RUB | Solvency index Globas | ||||
| 2013 | 2014 | 2015 | 2016 | 2017 | ||
| 1 | 2 | 3 | 4 | 5 | 6 | 7 |
| 1 JSC GAZPROM INN 7736050003 Moscow Wholesale of solid, liquid and gaseous fuels and related products |
|
|
|
|
|
158 Superior |
| 2 JSC RUSSIAN RAILWAYS INN 7708503727 Moscow Activity of railway transport: intercity and international passenger transportation |
|
|
|
|
|
176 High |
| 3 JSC SURGUTHEFTEGAZ INN 8602060555 Khanty-Mansi autonomous district - Yugra (Tyumen region) Crude oil production |
|
|
|
|
|
185 High |
| 4 JSC ROSNEFTEGAZ INN 7705630445 Moscow Holding companies management activities |
|
|
|
|
|
218 Strong |
| 5 JSC ROSNEFT OIL COMPANY INN 7706107510 Moscow Crude oil production |
|
|
|
|
|
209 Strong |
| 996 LLC FORD SOLLERS HOLDING INN 1646021952 Republic of Tatarstan Manufacture of motor vehicles |
|
|
|
|
|
311 Adequate |
| 997 JSC AMMONI INN 1627005779 Republic of Tatarstan Production of fertilizers and nitrogen compounds |
|
|
|
|
|
279 Medium |
| 998 LLC AGRO – LIGA INN 1650195013 Republic of Tatarstan Trade with automotive parts, components and accessories |
|
|
|
|
|
340 Adequate |
| 999 JSC ANTIPINSKY REFINERY INN 7204084481 Tyumen region Production of petroleum products |
|
|
|
|
|
276 Medium |
| 1000 JSC YAMAL LNG INN 7709602713 Yamal-Nenets autonomous district (Tyumen region) Liquefaction and cleaning of natural gas at the production site for subsequent transportation |
|
|
|
|
|
245 Strong |
![]() — growth of indicator in comparison with prior period,
— growth of indicator in comparison with prior period, ![]() — decrease of indicator in comparison with prior period.
— decrease of indicator in comparison with prior period.
Over the past 5 years, the average values of net assets of TOP-1000 companies showed the increasing tendency (Picture 1).
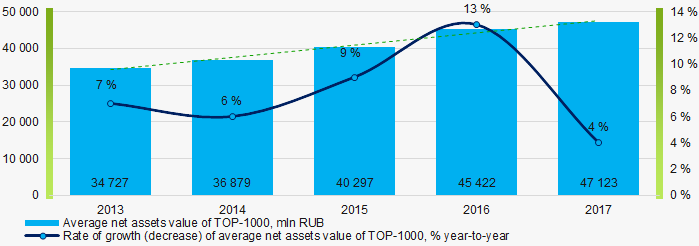 Picture 1. Change in average net assets value in 2013 – 2017
The shares of TOP-1000 companies with insufficient property have trend to increase over the past five years (Picture 2).
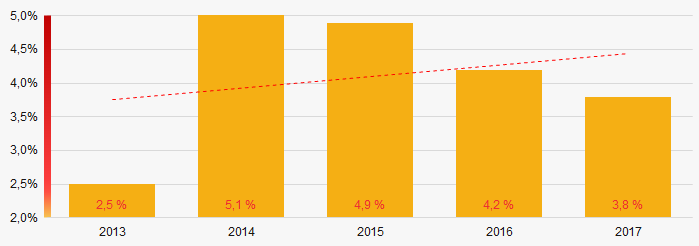 Picture 2. Shares of companies with negative net assets value in TOP-1000
Sales revenue
In 2017, total revenue of 10 largest companies was 55% of TOP-1000 total revenue (Picture 3). This testifies high level of concentration of capital in 10 most populated regions of Russia.
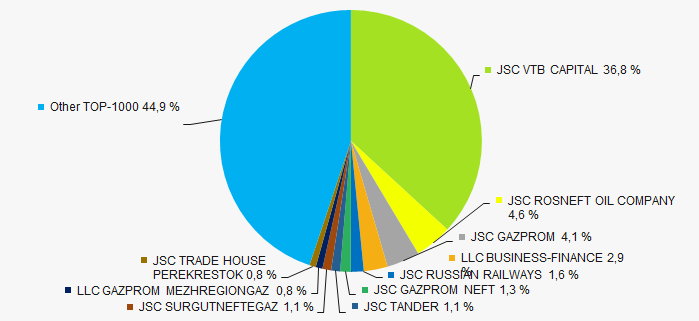 Picture 3. Shares of TOP-10 companies in TOP-1000 total profit for 2017
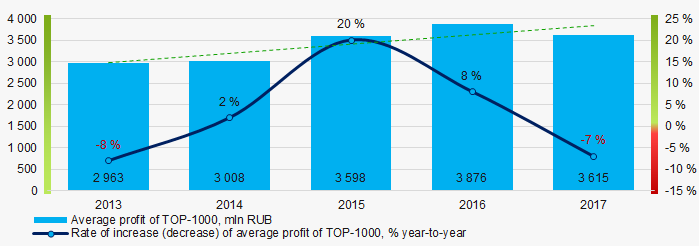
In general, there is a trend to increase in revenue (Picture 4).
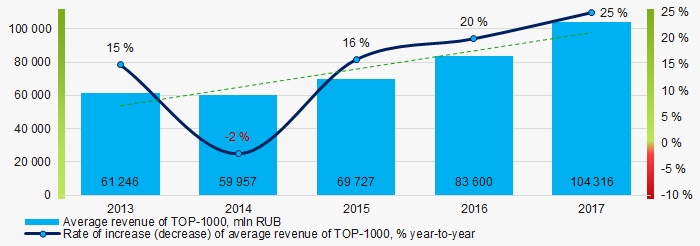 Picture 4. Change in average net profit in 2013-2017
Profit and loss
In 2017, profit of 10 largest companies amounted to 33% of TOP-1000 total profit (Picture 5).
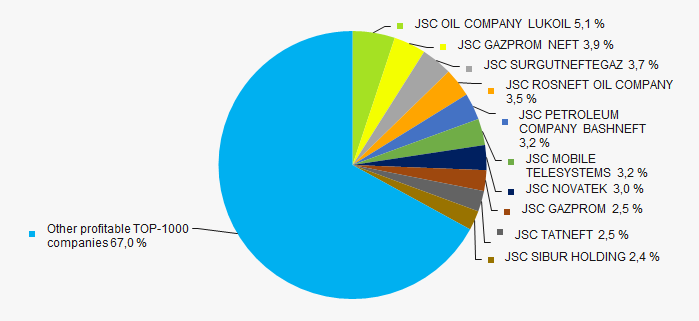 Picture 5. Shares of TOP-10 companies in TOP-1000 total profit for 2017
Over the past five years, there is an increase of the average industry net profit values of TOP-1000 companies (Picture 6).
 Picture 6. Change in average net profit (loss) of TOP-1000 companies in 2013-2017
Over the five-year period, the average net profit values of TOP-1000 companies show the increasing tendency. At the same time, the average net loss also increases (Picture 7).
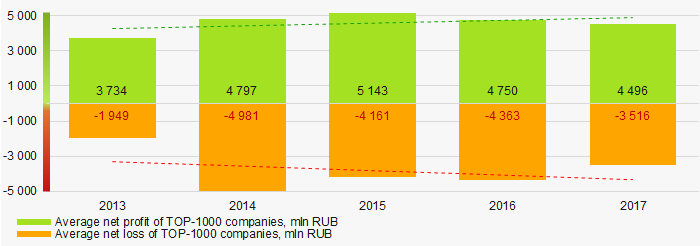 Picture 7. Change in average profit and loss of ТОP-1000 in 2013 – 2017
Key financial ratios
Over the five-year period, the average values of the current liquidity ratio were within the recommended one - from 1,0 to 2,0 with a trend to increase (Picture 8).
Current liquidity ratio (current assets to short-term liabilities) shows the sufficiency of company’s assets to repay on short-term liabilities.
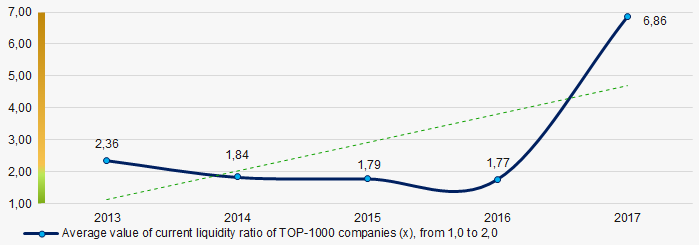 Picture 8. Change in average values of current liquidity ratio of TOP-1000 companies in 2013 – 2017
Over the past five years, there is relatively high level of ROI ratio with a trend to increase (Picture 9).
ROI ratio is calculated as net profit to sum of shareholders equity and long-term liabilities, and shows the return of equity involved in commercial activities and long-term borrowed funds.
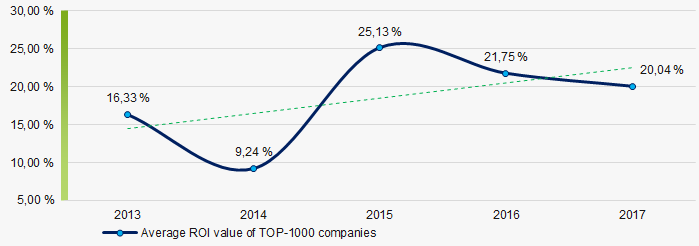 Picture 9. Change in average values of ROI ratio of TOP-1000 companies in 2013 – 2017
Assets turnover ratio is the ratio of sales revenue and company’s average total assets for a period. It characterizes the effectiveness of using of all available resources, regardless the source of their attraction. The ratio shows how many times per year the full cycle of production and circulation is performed, generating the corresponding effect in the form of profit.
Over the past five years, the ratio demonstrated the downward trend (Picture 10).
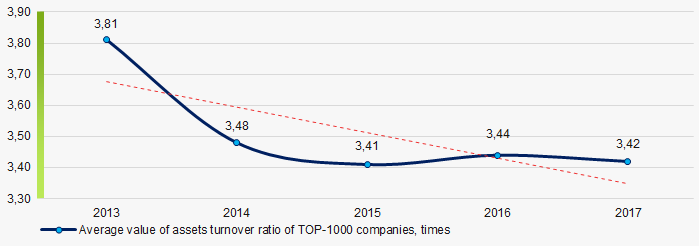 Picture 10. Change in average values of assets turnover ratio of TOP-1000 companies in 2013 – 2017
Production structure
The highest share in total revenue of TOP-1000 falls for companies engaged in financial services and wholesale (Picture 11).
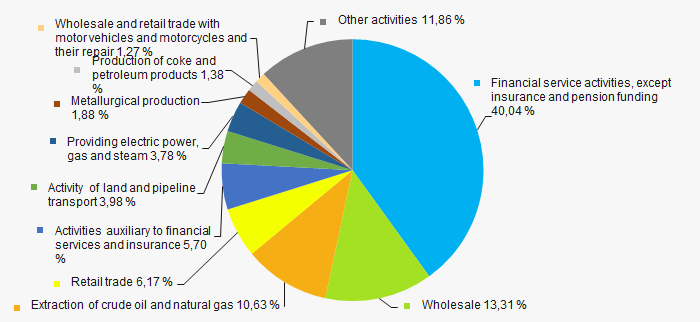 Picture 11. Distribution of activity types in total revenue of TOP-1000, %
Only 2 companies of TOP-1000 are registered in the Register of small and medium-sized businesses of the Federal Tax Service of the Russian Federation. Their share in total revenue of TOP-1000 companies is 0,1% (Picture 12).
Main regions of activity
Companies of TOP-1000 are unequally located across the regions. 76% of companies largest by revenue are located in Moscow and Saint Petersburg (Picture 12).
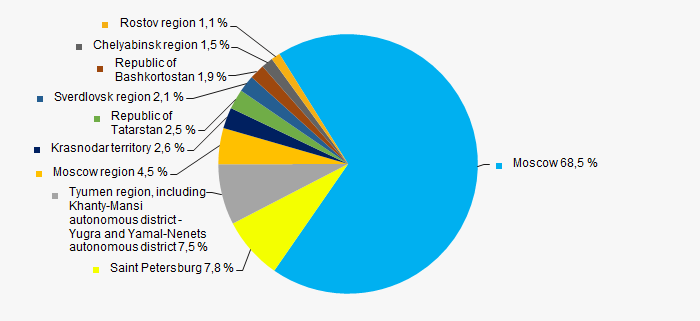 Picture 12. Distribution of TOP-1000 revenue by 10 most populated regions of Russia
Financial position score
Assessment of the financial position of TOP-1000 companies shows that the majority of them have stable financial position and financial position above average (Picture 13).
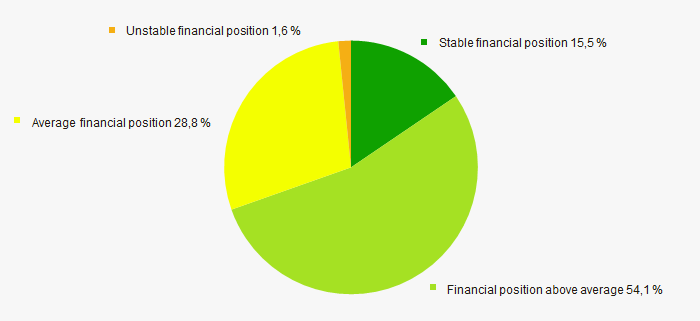 Picture 13. Distribution of TOP-1000 companies by financial position score
Solvency index Globas
Most of TOP-1000 companies got Superior/High or Strong/Medium Solvency index Globas, this fact shows their ability to meet obligations in time and fully (Picture 14).
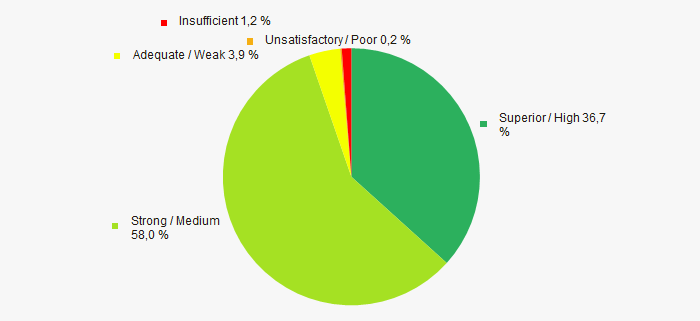 Picture 14. Distribution of TOP-1000 companies by solvency index Globas
Index of industrial production
According to the Federal State Statistics Service (Rosstat), during 12 months of 2018, the trend to increase of industrial production indexes is observed. (Picture 15).
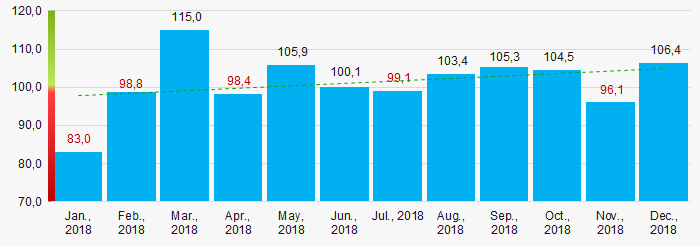 Picture 15. Average index of industrial production of 10 most populated regions of Russia in 2018, month-to-month (%)
According to the same data, the share of companies located in 10 most populated regions in total revenue from sales of goods, products, works and services for 9 months of 2018 is 40,81% countrywide.
Conclusion
Complex assessment of activity of the largest operating companies of 10 most populated regions of Russia, taking into account the main indexes, financial ratios and indicators, demonstrates the prevalence of favorable trends (Table 2).
| Trends and evaluation factors of TOP-1000 companies | Relative share of factors, % |
| Rate of growth (decline) in the average size of net assets | |
| Increase / decrease in the share of enterprises with negative values of net assets | |
| Rate of growth (decline) in the average size of revenue | |
| Concentration level of capital | |
| Rate of growth (decline) in the average size of profit (loss) | |
| Growth / decline in average values of companies’ net profit | |
| Growth / decline in average values of companies’ net loss | |
| Increase / decrease in average values of total liquidity ratio | |
| Increase / decrease in average values of return on investment ratio | |
| Increase / decrease in average values of asset turnover ratio, times | |
| Share of small and medium-sized businesses in the region in terms of revenue being more than 22% | |
| Regional concentration | |
| Financial position (the largest share) | |
| Solvency index Globas (the largest share) | |
| Industrial production index | |
| Average value of relative share of factors | |
![]() — positive trend (factor) ,
— positive trend (factor) , ![]() — negative trend (factor).
— negative trend (factor).