
Order a report
Custom-made industry research, company ratings, competitor analysis


Activity trends of the largest companies of the Rostov region
Information agency Credinform represents an overview of activity trends of the largest companies in the real sector of the economy of the Rostov region.
Enterprises with the largest volume of annual revenue of the Rostov region (TOP-10 and TOP-1000), were selected for the analysis, according to the data from the Statistical Register for the latest available periods (2014 — 2016). The analysis was made on the basis of the data of the Information and Analytical system Globas.
Net assets are the indicator, reflecting the real value of company’s property. It is calculated annually as the difference between assets on the enterprise balance and its debt obligations. The indicator of net assets is considered negative (insufficiency of property), if company’s debt exceeds the value of its property.
| № in TOP-1000 | Name, INN | Net assets value, mln RUB* | Solvency index Globas | ||
| 2014 | 2015 | 2016 | |||
| 1 | 2 | 3 | 4 | 5 | 6 |
| 1. | ROSTOV HELICOPTER PRODUCTION COMPLEX ROSTVERTOL PUBLIC LIMITED COMPANY INN 6161021690 Manufacture of helicopters, airplanes and other aircraft |
14 694 | 20 745 | 34 756 | 163 Superior |
| 2. | GLORIA JEANS CORPORATION JSC INN 6166034397 Manufacture of other overclothes |
10 607 | 12 781 | 16 376 | 184 High |
| 3. | GAZENERGOSET ROZNITSA LLC INN 6164317329 Retail sale of motor fuel in specialized stores |
-138 | 15 222 | 16 227 | 228 Strong |
| 4. | COMBINE PLANT ROSTSELMASH LTD. INN 6166048181 Manufacture of machines and agricultural equipment for soil handling |
7 823 | 10 569 | 14 976 | 167 Superior |
| 5. | GAZPROM GAZORASPREDELENIE ROSTOV-NA-DONU PJSC INN 6163000368 Distribution of gaseous fuel through gas distribution networks |
9 523 | 10 602 | 12 432 | 191 High |
| 996. | CONFECTIONERY FACTORY MISHKINO LLC INN 6102032852 Manufacture of cocoa, chocolate and sugar confectionery |
-877 | -1 469 | -2 068 | 324 Adequate |
| 997. | DON-ANTHRACITE PUBLIC COMPANY INN 6144009894 Extraction of anthracite by underground method |
-2 759 | -4 712 | -2 763 | 287 Medium |
| 998. | NORTH-CAUCASIAN PASSENGER SUBURBAN COMPANY JSC INN 6162051289 Transportation of passengers by rail on suburban routes in a regulated sector |
-2 440 | -2 626 | -2 835 | 312 Adequate |
| 999. | PALMALI CO. LTD. INN 6164087026 Activities of sea freight transport Case on declaring the company bankrupt (insolvent) is proceeding |
1 986 | -3 038 | -2 854 | 550 Insufficient |
| 1000. | REMZ LTD INN 6155054289 Manufacture of ingot steel Case on declaring the company bankrupt (insolvent) is proceeding |
1 172 | -1 728 | -3 039 | 550 Insufficient |
* — the indicators of growth or decline to the previous period are marked in columns 4 and 5 with green and red fillings, respectively.
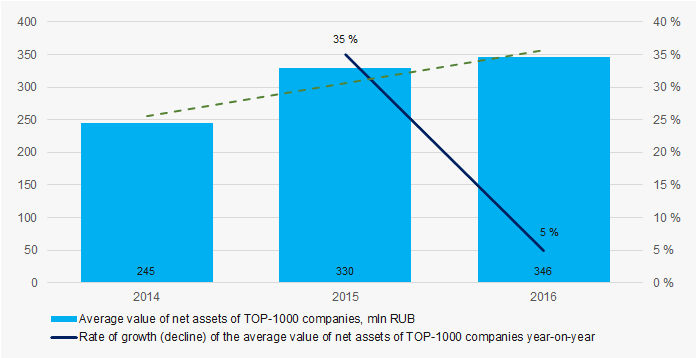 Picture 1. Change in the average indicators of the net asset value of TOP-1000 companies of the Rostov region in 2014 — 2016
Sales revenue
The revenue of 10 industry leaders made 26% of the total revenue of TOP-1000 companies in 2016. It points to the concentration of large companies in the Rostov region (Picture 2).
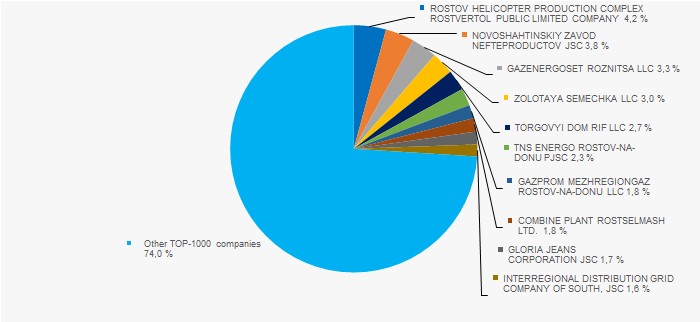 Picture 2. Shares of participation of TOP-10 companies in the total revenue of TOP-1000 companies for 2016
In general, there is a trend towards an increase in revenue volume (Picture 3).
 Picture 3. Change in the average indicators of revenue of TOP-1000 companies of the Rostov region in 2014 — 2016
Profit and losses
The profit volume of 10 industry leaders made 45% of the total profit of TOP-1000 companies in 2016 (Picture 4).
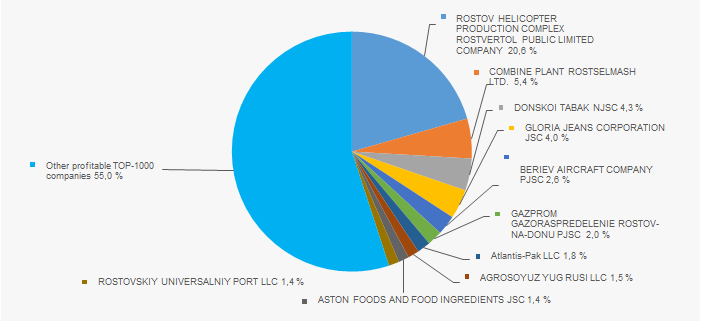 Picture 4. Share of participation of TOP-10 companies in the total volume of profit of TOP-1000 companies for 2016
Average values of profit’s indicators of TOP-1000 companies for the three-year period trend to increase, while the average value of net loss decreases (Picture 5).
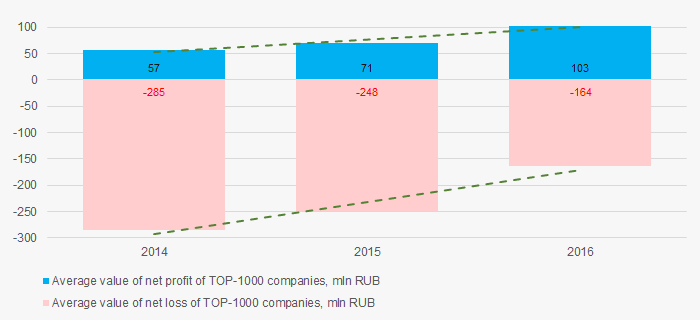 Picture 5. Change in the average values of profit and loss indicators of TOP-1000 companies of the Rostov region in 2014 — 2016
Key financial ratios
The total liquidity ratio (the relation of the amount of current assets to short-term liabilities) shows the sufficiency of company’s funds for repayment of its short-term liabilities.
Over the three-year period the industry average indicators of the total liquidity ratio were above the range of recommended values — from 1,0 up to 2,0 (Picture 6). In general, the ratio indicator tends to increase.
The experts of the Information agency Credinform, taking into account the actual situation both in the economy as a whole and in the sectors, has developed and implemented in the Information and Analytical system Globas the calculation of practical values of financial ratios that can be recognized as normal for a particular industry.
For companies of the Rostov region the practical value of the total liquidity ratio made from 1,79 up to 1,38, respectively.
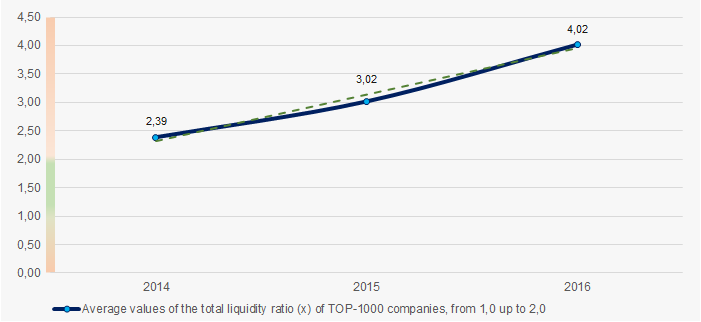 Picture 6. Change in the average values of the total liquidity ratio of TOP-1000 companies of the Rostov region in 2014 — 2016
The return on investment ratio is calculated as the relation of net profit to the sum of own capital and long-term liabilities and demonstrates the return on the equity involved in the commercial activity of own capital and the long-term borrowed funds of an organization.
There has been a trend towards a decrease in indicators of the return on investment ratio for three years (Picture 7).
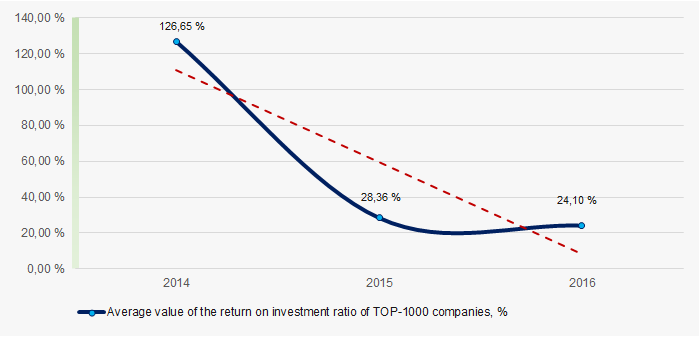 Picture 7. Change in the average values of the return on investment ratio of TOP-1000 companies of the Rostov region in 2014 — 2016
Asset turnover ratio is calculated as the relation of sales proceeds to the average value of total assets for a period and characterizes the efficiency of use of all available resources, regardless of the sources of their attraction. The ratio shows how many times a year a complete cycle of production and circulation is made, yielding profit.
As a whole, this ratio of business activity showed a tendency to decrease over the three-year period (Picture 8).
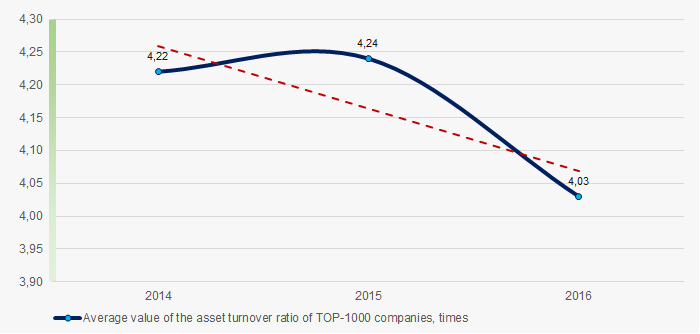 Picture 8. Change in the average values of the asset turnover ratio of TOP-1000 companies of the Rostov region in 2014 — 2016
Production structure
The largest share in the total revenue of TOP-1000 is owned by companies, specializing in whole sale (Picture 9).
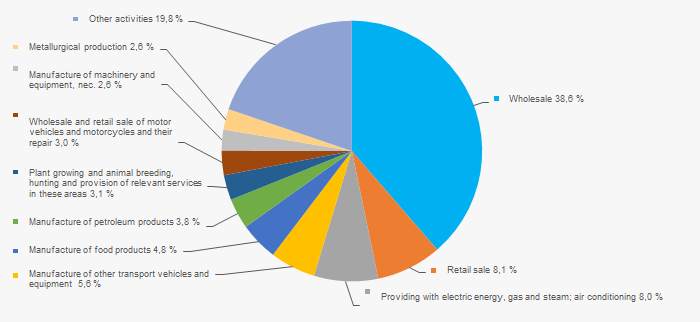 Picture 9. Distribution of types of activity in the total revenue of TOP-1000 companies, %
61% of TOP-1000 companies are registered in the Register of small and medium-sized businesses of the Federal Tax Service of the RF (Picture 10).
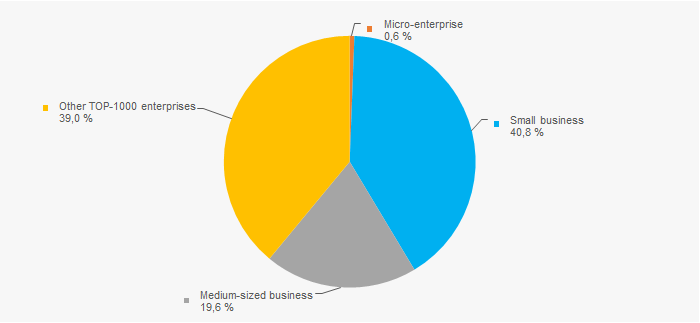 Picture 10. Shares of small and medium-sized businesses in TOP-1000 companies of the industry, %
Financial position score
An assessment of the financial position of companies in the industry shows that their the largest number are in a stable financial position and above the average (Picture 11).
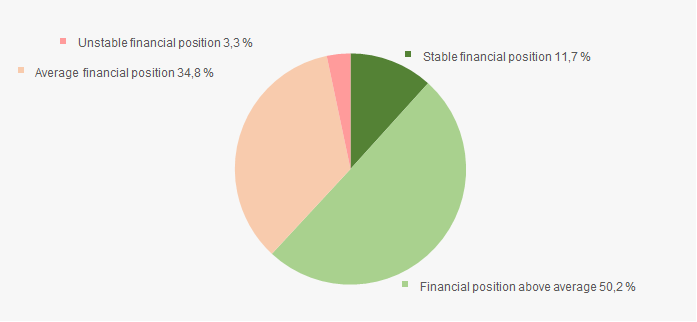 Picture 11. Distribution of TOP-1000 companies by financial position score
Solvency index Globas
Most of TOP-1000 companies got Superior/High or Strong/Medium Solvency index Globas, that points to their ability to pay off their debts in time and fully (Picture 12).
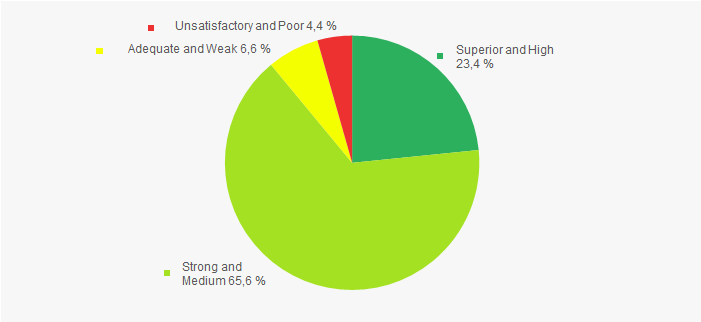 Picture 12. Distribution of TOP-1000 companies by solvency index Globas
Conclusion
A comprehensive assessment of activity of the largest companies of the real sector of the economy of the Rostov region, taking into account the main indices, financial indicators and ratios, indicates the prevalence of favorable trends in the industry. However declining investment and business activity are alarming factors.