
Order a report
Custom-made industry research, company ratings, competitor analysis


Top industries by turnover dynamics of companies in 2019-2020
The Federal State Statistics Service (hereinafter “Rosstat”) has published information concerning 2020 turnover of companies in Russia. The COVID-19 crisis and limitations had various impact on companies in dependence to the industry. Transport enterprises, servicing and mining companies suffered the most. Pharmaceutical holdings, IT companies and delivery services had benefits.
In general, the period from April 2020 to July 2020 was the hardest for the economy. Turnover of companies have decreased for 4 months to the same period of 2019. In April and May there was recorded a 12,9% and 11,8% reduction respectively (see Picture 1).
The period of recovery started in August was at its peak in December when there was a 11,6% increase in turnover compared to December 2019. At the year end, surpassing 202 trillion RUB, the comprehensive turnover of companies exceeded the figures of 2019 by 2,4%.
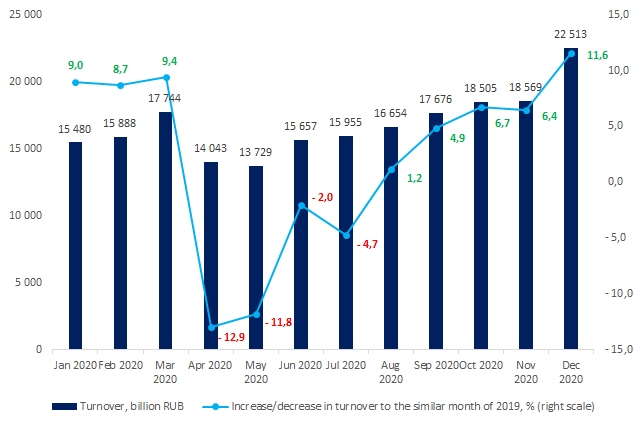 Picture 1. Turnover dynamics of companies in Russia in 2020
Speaking about industry-based figures, the turnover of companies engaged in railroad passenger transportation reduced by 58,2% in 2020, airline companies – by 41,8%, hotels – by 33%, crude oil and gas producers – by 24,2% (see Table 1).
At the same time, pharmaceutical companies increased their turnover from 633 billion RUB to 946 billion RUB (1,5%), IT companies - by 33,4% and post and delivery services – by 28,9%.
These figures prove the peculiarity of the current economic situation both inside the country and on foreign markets.
| Activity | OKVED2 code | 2019 turnover, billion RUB | 2020 turnover, billion RUB | Increase/decrease in turnover, % | Share in total turnover, % |
| Total | - | 197 733 | 202 413 | 2,4 | 100,0 |
| Production of medicines and materials | 21 | 633 | 946 | 49,3 | 0,5 |
| IT | 63 | 414 | 552 | 33,4 | 0,3 |
| Post and delivery services | 53 | 230 | 296 | 28,9 | 0,1 |
| Manufacture of tobacco products | 12 | 239 | 294 | 22,9 | 0,1 |
| Mining of metal ores | 07 | 1 550 | 1 882 | 21,4 | 0,9 |
| Metallurgical production | 24 | 6 676 | 7 796 | 16,8 | 3,9 |
| Plant growing and cattle breeding | 01 | 2 793 | 3 257 | 16,6 | 1,6 |
| Manufacture of rubber and plastic products | 22 | 1 119 | 1 295 | 15,7 | 0,6 |
| Production, transmission and distribution of steam and hot water | 35.3 | 1 275 | 1 467 | 15,0 | 0,7 |
| Water supply; sewerage, organization of waste collection and disposal | E | 1 166 | 1 336 | 14,5 | 0,7 |
| Construction | F | 7 056 | 8 068 | 14,3 | 4,0 |
| Manufacture of textiles | 13 | 253 | 284 | 12,1 | 0,1 |
| Manufacture of wearing apparel | 14 | 250 | 280 | 11,8 | 0,1 |
| Food production | 10 | 5 648 | 6 274 | 11,1 | 3,1 |
| Wholesale | 46 | 52 058 | 57 342 | 10,2 | 28,3 |
| Wood processing and manufacture of wood and cork products, excluding furniture | 16 | 647 | 711 | 9,8 | 0,4 |
| Forestry and logging | 02 | 232 | 254 | 9,3 | 0,1 |
| Manufacture of other finished goods | 32 | 244 | 266 | 9,2 | 0,1 |
| Telecommunication activities | 61 | 1 999 | 2 148 | 7,5 | 1,1 |
| Computer software development | 62 | 1 221 | 1 312 | 7,4 | 0,6 |
| Fishing and fish farming | 03 | 354 | 380 | 7,3 | 0,2 |
| Manufacture of other non-metal mineral products | 23 | 1 645 | 1 765 | 7,3 | 0,9 |
| Manufacture of electrical equipment | 27 | 1 082 | 1 160 | 7,3 | 0,6 |
| Activities in the field of health and social services | Q | 2 955 | 3 146 | 6,4 | 1,6 |
| Water transport activities | 50 | 257 | 273 | 5,9 | 0,1 |
| Retail trade | 47 | 17 987 | 18 949 | 5,4 | 9,4 |
| Real estate operations | L | 2 829 | 2 974 | 5,1 | 1,5 |
| Activities in the field of culture, sports, leisure and entertainment | R | 303 | 318 | 4,8 | 0,2 |
| Production of chemicals and products | 20 | 3 040 | 3 173 | 4,4 | 1,6 |
| Manufacture of machinery and equipment | 28 | 1 390 | 1 446 | 4,1 | 0,7 |
| Manufacture of paper and paper products | 17 | 1 054 | 1 091 | 3,5 | 0,5 |
| Trade in motor vehicles and motorcycles | 45 | 6 956 | 7 157 | 2,9 | 3,5 |
| Manufacture of computers, electronic and optical items | 26 | 1 407 | 1 444 | 2,6 | 0,7 |
| Freight rail transport | 49.2 | 2 145 | 2 199 | 2,6 | 1,1 |
| Manufacturing of finished metal products | 25 | 2 680 | 2 746 | 2,5 | 1,4 |
| Furniture manufacture | 31 | 267 | 272 | 2,0 | 0,1 |
| Manufacture of other vehicles and equipment | 30 | 1 957 | 1 982 | 1,3 | 1,0 |
| Electricity production, transmission and distribution | 35.1 | 7 194 | 7 249 | 0,8 | 3,6 |
| Warehousing and auxiliary transport activities | 52 | 4 011 | 4 028 | 0,4 | 2,0 |
| Administrative activities | N | 1 613 | 1 617 | 0,2 | 0,8 |
| Professional, scientific and technical activities | M | 5 513 | 5 521 | 0,2 | 2,7 |
| Other industries | - | 3 965 | 3 919 | -1,1 | 1,9 |
| Publishing activities | 58 | 124 | 120 | -2,9 | 0,1 |
| Manufacture of leather and leather products | 15 | 80 | 77 | -4,0 | 0,0 |
| Pipeline transport activities | 49.5 | 2 858 | 2 715 | -5,0 | 1,3 |
| Beverages production | 11 | 933 | 883 | -5,3 | 0,4 |
| Manufacture of motor vehicles, trailers and semi-trailers | 29 | 2 888 | 2 735 | -5,3 | 1,4 |
| Production and distribution of gaseous fuels | 35.2 | 1 447 | 1 359 | -6,1 | 0,7 |
| Freight transport activities | 49.4 | 1 309 | 1 219 | -6,9 | 0,6 |
| Printing activities and copying of information carriers | 18 | 305 | 282 | -7,8 | 0,1 |
| Education | P | 608 | 560 | -7,9 | 0,3 |
| Extraction of other minerals | 08 | 587 | 540 | -7,9 | 0,3 |
| Coal mining | 05 | 1 415 | 1 200 | -15,1 | 0,6 |
| Restaurant services | 56 | 1 073 | 907 | -15,4 | 0,4 |
| Activities of other land passenger transport | 49.3 | 484 | 403 | -16,6 | 0,2 |
| Production of coke and petroleum products | 19 | 12 764 | 9 928 | -22,2 | 4,9 |
| Extraction of crude oil and natural gas | 06 | 12 378 | 9 377 | -24,2 | 4,6 |
| Hotel services | 55 | 278 | 186 | -33,0 | 0,1 |
| Air transport activities | 51 | 1 570 | 914 | -41,8 | 0,5 |
| Intercity and international railway passenger transportation | 49.1 | 325 | 136 | -58,2 | 0,1 |
Source: Rosstat, analysis by Credinform
Methodology:
Turnover includes the cost of own-produced shipped goods, own-performed works and services, as well as proceeds from the sale of goods purchased (excluding value added tax, excise taxes and other similar payments).
The data of current statistics on "turnover" for the full range of enterprises are formed monthly on the basis of information from the unified form of federal statistical observation No. P-1 "Information on the production and shipment of goods and services" and an additional calculation for the aggregate of enterprises for which there is no monthly data.
The Federal statistical observation form No. P-1 is provided by all legal entities that are commercial organizations, as well as non-commercial organizations of all types of ownership that manufacture goods and services for sale to other legal entities and individuals (except for small businesses, banks, insurance and other financial and credit institutions), the average number of employees of which for the previous year exceeds 15 people, including those working part-time and under civil law contracts.
The additional calculation of data is made for the aggregate of small enterprises and enterprises with the average number of employees for the previous year exceeding 15 people, including those working part-time and under civil law contracts, which are not small businesses.