
Order a report
Custom-made industry research, company ratings, competitor analysis


Trends in vehicle manufacturing
Information agency Credinform has prepared a review of trends of the largest Russian manufacturers of marine, rail and air vehicles and equipment.
The largest manufacturers of marine, rail, air vehicles and equipment, excluding road transport and military vehicles (TOP-10 and TOP-1000) in terms of annual revenue were selected for the analysis according to the data from the Statistical Register for the latest available periods (2015-2017). The analysis was based on the data of the Information and Analytical system Globas.
Net assets are total assets less total liabilities. This indicator reflects the real value of the property of an enterprise. When the company’s debt exceeds the value of its property, the indicator is considered negative (insufficiency of property).
| № | Name, INN, activity | Net assets value, bln RUB | Solvency index Globas | ||
| 2015 | 2016 | 2017 | |||
| 1 | 2 | 3 | 4 | 5 | 6 |
| 1 | JSC UNITED SHIPBUILDING CORPORATION INN 7838395215 Saint Petersburg Construction of ships, vessels and floating structures |
164,70 | |
|
257 Medium |
| 2 | JSC AVIATION HOLDING COMPANY SUKHOI INN 7740000090 Moscow Manufacture of helicopters, airplanes and other aircraft |
189,16 | |
|
163 Superior |
| 3 | JSC SUKHOI CIVIL AIRCRAFT INN 7714175986 Moscow Manufacture of helicopters, airplanes and other aircraft |
-30,29 | |
|
256 Medium |
| 4 | JSC PRODUCTION ASSOCIATION SEVMASH INN 2902059091 Arkhangelsk region Construction of ships, vessels and floating structures |
33,60 | |
|
170 Superior |
| 5 | JSC ULAN-UDE AVIATION PLANT INN 0323018510 Republic of Buryatia Manufacture of helicopters, airplanes and other aircraft |
43,84 | |
|
222 Strong |
| 996 | JSC LYUDINOVSKY DIESEL LOCOMOTIVE PLANT INN 4024000014 Kaluga region Services for reconstruction and equipping (completion) of railway locomotives, tram motor cars and other rolling stock |
0,01 | |
|
318 Adequate |
| 997 | JSC ENGELS LOCOMOTIVE PLANT INN 6449062691 Saratov region Manufacture of railway locomotives and rolling stock |
-0,42 | |
|
341 Adequate |
| 998 | JSC NOVOKUZNETSK CAR BUILDING PLANT INN 4217101428 Kemerovo region Manufacture of non-self-propelled railway, tram and other cars for the transport of goods In liquidation since 02.03.2017 |
-0,37 | |
|
600 Insufficient |
| 999 | JSC ARMAVIR HEAVY ENGINEERING PLANT INN 2302044590 Krasnodar territory Manufacture of non-self-propelled railway, tram and other cars for the transport of goods In liquidation since 13.07.2016 |
-2,64 | |
|
600 Insufficient |
| 1000 | JSC PROMTRAKTOR-VAGON INN 2128701370 Republic of Chuvashia Services for reconstruction and equipping (completion) of railway locomotives, tram motor cars and other rolling stock |
-4,81 | |
|
366 Adequate |
![]() — growth of indicator in comparison with prior period,
— growth of indicator in comparison with prior period, ![]() — decrease of indicator in comparison with prior period.
— decrease of indicator in comparison with prior period.
For the last 10 years, the average values of net assets showed the increasing tendency (Picture 1).
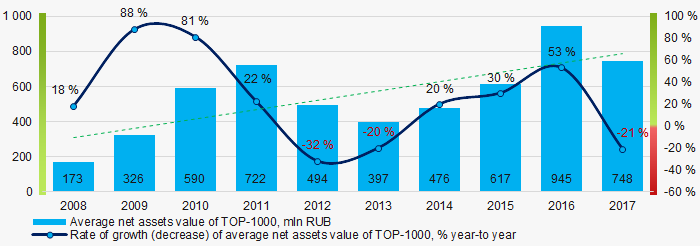 Picture 1. Change in average net assets value in 2008 – 2017
The shares of TOP-1000 companies with insufficient property have trend to increase over the past three years (Picture 2).
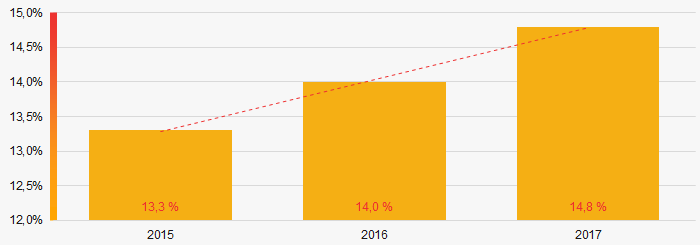 Picture 2. Shares of companies with negative net assets value in TOP-1000, 2015 - 2017
Sales revenue
In 2017, total revenue of 10 largest companies was 45% of TOP-1000 total revenue (Picture 3). This testifies high level of monopolization in the industry.
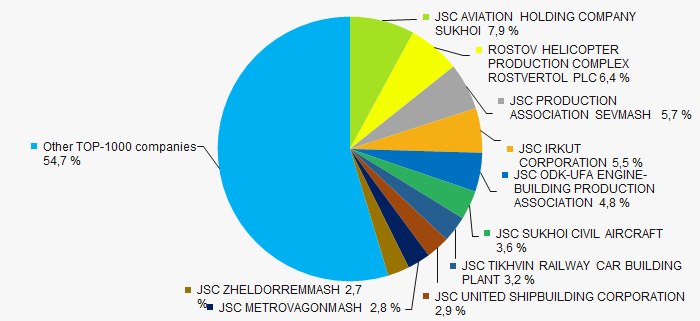 Picture 3. Shares of TOP-10 companies in TOP-1000 total profit for 2017
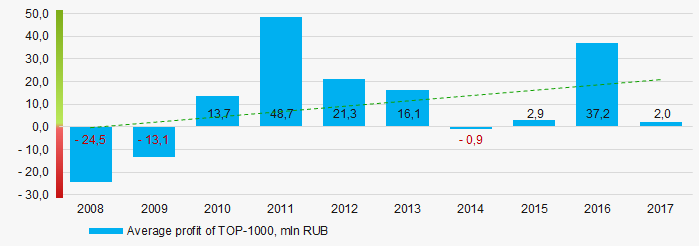
In general, there is a trend to increase in industry average revenue over the past 10 years (Picture 4).
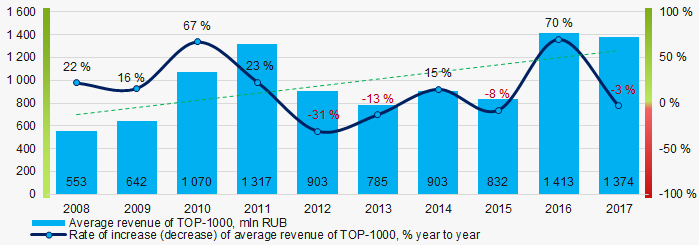 Picture 4. Change in industry average net profit in 2008-2017
Profit and loss
In 2017, profit of 10 largest companies in the region amounted to 60% of TOP-1000 total profit (Picture 5).
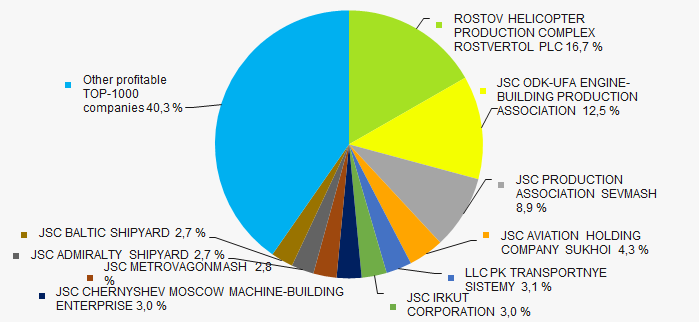 Picture 5. Shares of TOP-10 companies in TOP-1000 total profit for 2017
For the last ten years, there is an increase of the industry average net profit values (Picture 6).
 Picture 6. Change in industry average net profit (loss) in 2008-2017
For the three-year period, the average net profit values of TOP-1000 companies show the increasing tendency. The average net loss also increases (Picture 7).
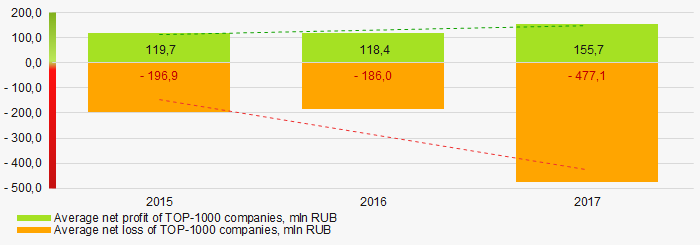 Picture 7. Change in average profit and loss of ТОP-1000 in 2015 – 2017
Key financial ratios
For the last ten years, the average values of the current liquidity ratio were above the recommended one - from 1,0 to 2,0 with a trend to increase (Picture 8).
Current liquidity ratio (current assets to short-term liabilities) shows the sufficiency of company’s assets to repay on short-term liabilities.
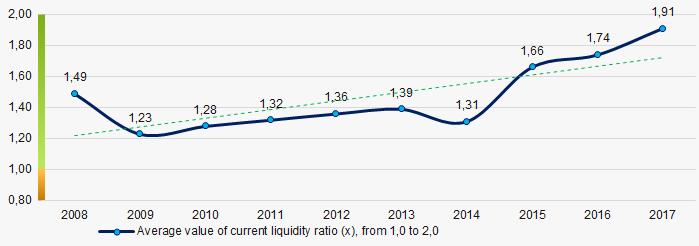 Picture 8. Change in industry average values of current liquidity ratio in 2008 – 2017
For the last ten years, relatively low level of ROI ratio with a trend to increase was observed (Picture 9).
ROI ratio is calculated as net profit to sum of shareholders equity and long-term liabilities, and shows the return of equity involved in commercial activities and long-term borrowed funds.
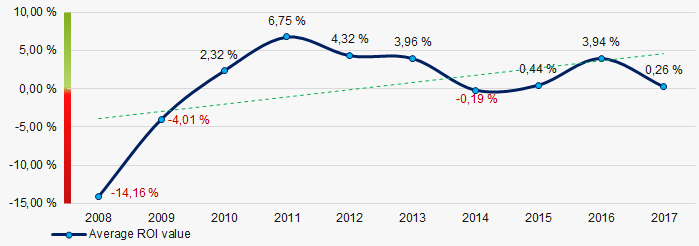 Picture 9. Change in average values of ROI ratio in 2008 – 2017
Assets turnover ratio is the ratio of sales revenue and company’s average total assets for a period. It characterizes the effectiveness of using of all available resources, regardless the source of their attraction. The ratio shows how many times per year the full cycle of production and circulation is performed, generating the corresponding effect in the form of profit.
For the last ten years, business activity ratio demonstrated the downward trend (Picture 10).
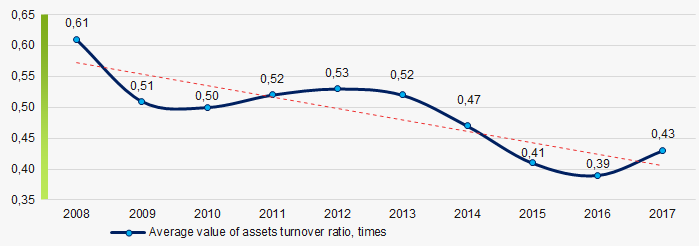 Picture 10. Change in average values of assets turnover ratio in 2008 – 2017
Production structure
The highest share in total revenue of TOP-1000 falls for companies engaged in manufacture of helicopters, planes and other aircraft (Picture 11).
 Picture 11. Distribution of activity types in total revenue of TOP-1000, %
73% companies of TOP-1000 are registered in the Register of small and medium-sized businesses of the Federal Tax Service of the Russian Federation. At the same time, their share in total revenue of TOP-1000 slightly exceeds 2% (Picture 12).
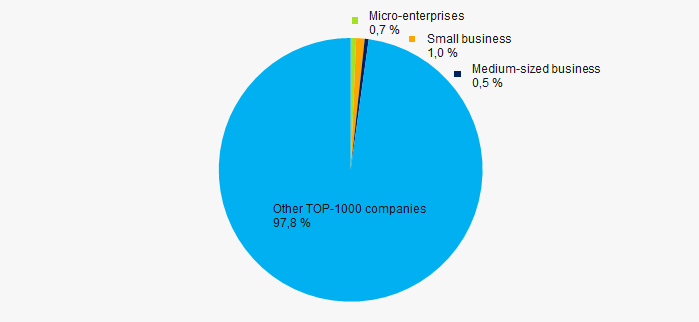 Picture 12. Shares of small and medium-sized enterprises in TOP-1000, %
Main regions of activity
Companies of TOP-1000 are located across the country extremely unequally, and registered in 67 districts. Almost 36% of their revenue volume are concentrated in Moscow and Saint Petersburg (Picture 13).
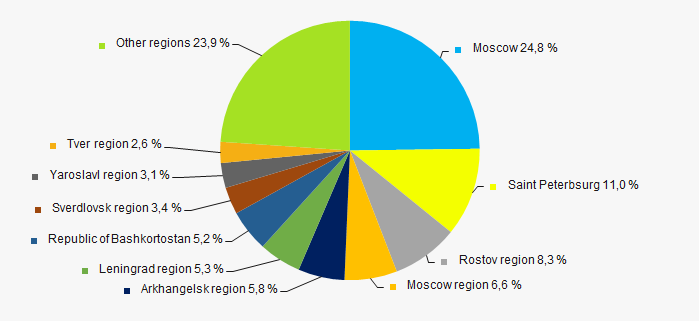 Picture 13. Distribution of TOP-1000 revenue by districts of Russia
Financial position score
Assessment of the financial position of TOP-1000 companies shows that the majority of them have average financial position (Picture 14).
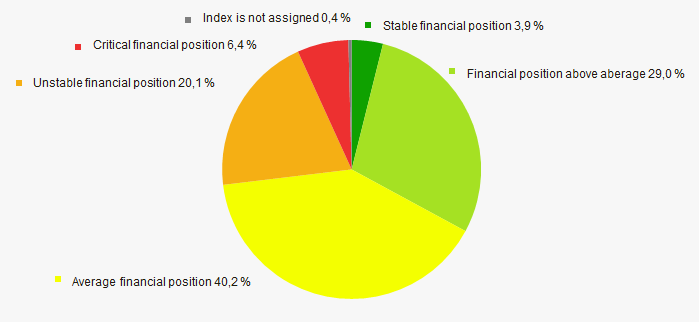 Picture 14. Distribution of TOP-1000 companies by financial position score
Solvency index Globas
Most of TOP-1000 companies got Superior/High or Strong/Medium Solvency index Globas. This fact shows the ability to meet their obligations in time and fully (Picture 15).
 Picture 15. Distribution of TOP-1000 companies by solvency index Globas
Index of industrial production
According to the Federal State Statistics Service (Rosstat), during 12 months of 2017 - 2018, the trend to decrease of industrial production indexes is observed. For 9 months of 2018, the index decreased by 0,8% at average, and increased by 2,1% for the period of November 2017 – October 2018 (Picture 16).
 Picture 16. Index of industrial production of vehicles and equipment in 2017 – 2018, month-to-month (%)
Conclusion
Complex assessment of activity of the largest manufacturers of vehicles and equipment, taking into account the main indexes, financial ratios and indicators, demonstrates some prevalence of favorable trends (Table 2).
| Trends and evaluation factors | Relative share of factors, % |
| Rate of growth (decline) in the average size of net assets | |
| Increase / decrease in the share of enterprises with negative values of net assets | |
| Rate of growth (decline) in the average size of revenue | |
| Concentration level of capital | |
| Rate of growth (decline) in the average size of profit (loss) | |
| Growth / decline in average values of companies’ net profit | |
| Growth / decline in average values of companies’ net loss | |
| Increase / decrease in average values of total liquidity ratio | |
| Increase / decrease in average values of return on investment ratio | |
| Increase / decrease in average values of asset turnover ratio, times | |
| Share of small and medium-sized businesses in the region in terms of revenue being more than 30% | |
| Regional concentration | |
| Financial position (the largest share) | |
| Solvency index Globas (the largest share) | |
| Industrial production index | |
| Average value of relative share of factors | |
![]() — positive trend (factor) ,
— positive trend (factor) , ![]() — negative trend (factor).
— negative trend (factor).