
Order a report
Custom-made industry research, company ratings, competitor analysis


Cash outflow in Russia: problem, benefit or necessity
Analysis of cash flows shows that practically there are normal and illegal cash outflow. Cash flows fall in the category of normal cash flow and are necessary, because they help export-import operations and financial activity of transnational corporations (TNC). Moreover, cash outflow is a benefit while incomes of the Russian TNC`s external assets and export operations are the source of cash inflow in Russia.
Illegal cash outflow (look «Reference information», table 1) is understood to be: use of illegal business schemes for capital outflow; cases of overcoming customs barriers; instruments of thin capitalization; facts of non-repayment of export income or non-payment of import contract and others.
According to the Central Bank of the RF (CB RF), cash outflow in Russia in 2014 was 153 billion USD (picture 1). During 15 years (2000-2014) cash outflow was predominant in Russia. Up to the year 2005 inclusive it was minor/ insignificant, especially on the back of the period of 2008-2014 and outbursts of financial crisis in 2008 and 2014. Cash inflow was in 2006-2007, when Russia seemed to be relatively stable amid the global financial crisis and probably became a place of financial capital maintenance.
Picture 1. Cash outflow (inflow«-»/outflow«+») by private sector in 2000-2014 and 2015-2016 (* - estimate), billion USD
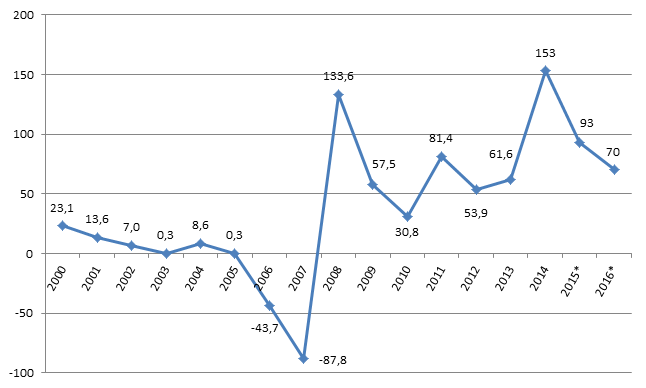
Reasons behind such significant volume of cash outflow are following: Necessity of payment of external debt in 2014 in an amount of 180 billion USD that made this reason the key element of cash outflow;
- Decrease in possibilities for debt refinancing, lack of access to the foreign markets financing because of economic sanctions imposed on Russia;
- Rouble devaluation, especially on December 2014, increased demand for hard currency, USD in particular, that became an impulse for cash outflow;
- Disinvestment in Russian markets on the back of unstable economic climate;
- Out of total sum of cash outflow in 2014 (the fourth quarter) about 20 billion USD accounted for REPO bargains with banks, however the money should be paid back.
The Ministry of Economic Development and Trade forecasts cash outflow in an amount of 93 billion USD at the end of 2015, and 70 billion USD - at the end of 2016. Predicted values are diminished, because external debt payments are planned to be measurably reduced, e.g. at the end of 2015 – 120 billion USD. Moreover, fall in oil prices in the world market may help. In this case a smaller source level will be required for such purpose. Also business may use tax amnesty that remains in force up to December 31, 2015.
Significant cash outflow is a big problem for the state, especially in respect to illegal cash outflow, because funds at the state`s disposal are decreased. Such situation leads to the investment reduction; slowdown in economic development; reduction of cash deposit in human capital assets by means of development of educational system, medicine, culture; prevention from social programs accomplishment and, finally, worsening of food supply security and country`s defense potential.
Reference information.
According to Russian analysts, who used balance of payment the CB RF data, for the period 2008-2013 cash outflow in Russia was 416.9 billion USD more than cash inflow. Almost 60% of this sum (about 249 billion USD) were accounted for illegal outflow (table 1).
It worth mentioning that illegal cash outflow significantly decreased because of the measures taken by the government, compared to 2001.
| 2001 | 2007 | 2009 | 2012 | 2013 | |
|---|---|---|---|---|---|
| Illegal cash outflow – total, billion USD | 15 416 | 44 230 | 30 953 | 49 187 | 37 998 |
| Illegal cash outflow, % of net cash outflow | 76,2 | 16,2 | 56,9 | 28,1 | 21,9 |