
Order a report
Custom-made industry research, company ratings, competitor analysis


The definition of «foreign investor» is specified
The definition of «foreign investor» is specified by the Federal Law of 31.05.2018 № 122-FL.
In particular, it is determined that legal entities, registered in offshore zones, according to the «List of states and territories, representing preferential tax regime and (or) not requiring disclosure and provision of information while carrying out financial transactions (offshore zones)», approved by the Order of the Ministry of Finance of the RF of 13.11.2007 № 108n (edited from 02.11.2017) and not disclosing data about their beneficiaries and controlling parties according to the procedure established by the Government of Russia cannot buy state and municipal property.
Earlier privatization of state property was forbidden for any legal entities registered in offshore zones.
Consequently, amendments made to the Federal Law «On procedure of foreign investments to business entities, having strategic importance for national defense and security», provide foreign investors with an opportunity to establish control over the enterprises having strategic importance, granted provision of data about beneficiaries and controlling parties to the authorized federal authority of executive power, performing control over foreign investments to Russia.
Besides, foreign companies, controlled by legal entities or citizens of Russia, are no longer determined as «foreign investor».
The definitions of «controlling party», «foreign investment» are also specified by the Federal Law.
According to the experts, such changes in the legal status of foreign investors should contribute to return to the national economy of funds of citizens of Russia, locating abroad, and increase visibility of incoming foreign investments.
For information:
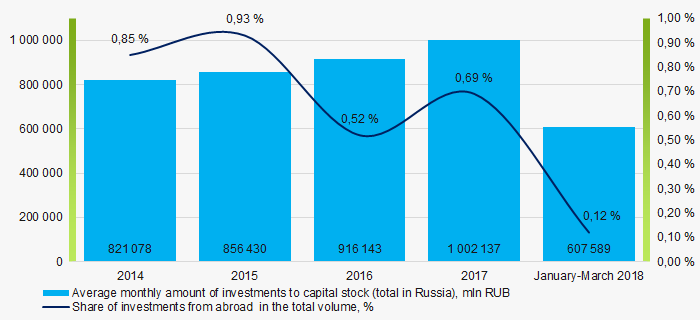 Puctire 1. Average monthly amount of investments to capital stock and share of investments from abroad in the total volume in Russia in 2014 — 2018 (according to the data from the Federal State Statistics Service on 05.06.2018)