
Order a report
Custom-made industry research, company ratings, competitor analysis


Service profitability of the largest Russian air transport service companies
The largest enterprises (TOP-10) in terms of annual revenue were selected according to the data from the Statistical Register for the latest available periods (2016 and 2015). Then the companies were ranged by service profitability ratio (Table 1). The analysis was based on data of the Information and Analytical system Globas.
Service or product profitability ratio (%) is a ratio of sales profit to general expenses. In general, the profitability characterizes the production efficiency. The analysis of service profitability allows to estimate the necessity of providing the services or carrying out works. There are no normative values for this group of ratios due to wide rage depending on the industry.
The calculation of practical values of financial indicators, which might be considered as normal for a certain industry, has been developed and implemented in the Information and Analytical system Globas by the experts of Information Agency Credinform, taking into account the actual situation of the economy as a whole and the industries. The practical value of service profitability ratio for the air transport service companies in 2016 starts from 26,28%.
For the most full and fair opinion about the company’s financial position, the whole set of financial indicators and ratios of the company should be taken into account.
| Name, INN, region | Net profit, mln RUB | Revenue, mln RUB | Service profitability ratio, % | solvency index Globas | |||
| 2015 | 2016 | 2015 | 2016 | 2015 | 2016 | ||
| 1 | 2 | 3 | 4 | 5 | 6 | 7 | 8 |
| NAO INTERNATIONAL AIRPORT SHEREMETYEVO INN 7712094033 Moscow region |
-7 860,4 | 15 523,8 | 22 911,1 | 25 181,6 | 60,67 | 92,36 | 217 Strong |
| NAO Sochi International Airport INN 2317044843 Krasnodar region |
857,2 | 1 405,3 | 3 623,5 | 4 579,6 | 51,27 | 86,41 | 203 Strong |
| PAO AIRPORT KOLTSOVO INN 6608000446 Sverdlovsk region |
719,5 | 700,4 | 4 425,1 | 4 564,4 | 46,74 | 46,62 | 183 High |
| NORTHERN CAPITAL GATEWAY LIMITED LIABILITY COMPANY INN 7703590927 Saint-Petersburg |
353,3 | 2 690,6 | 14 028,5 | 14 239,9 | 57,79 | 46,60 | 217 Strong |
| NAO FUEL REFILLING COMPLEX SHEREMETYEVO INN 5047058580 Moscow region |
-193,5 | 173,7 | 4 827,8 | 4 007,4 | 1,51 | 13,49 | 239 Strong |
| LLC DOMODEDOVO PASSENGER TERMINAL ИINN 5009097645 Moscow region |
507,3 | 1 484,3 | 11 023,0 | 10 882,4 | 13,07 | 13,03 | 249 Strong |
| LLC S 7 ENGINEERING INN 5009049835 Moscow region |
227,3 | 368,4 | 3 273,0 | 4 137,0 | 13,29 | 10,66 | 214 Strong |
| LLC Gazpromneft – AERO Sheremetyevo INN 5047095550 Moscow region |
54,9 | 1 421,2 | 22 761,2 | 24 448,6 | 0,05 | 8,50 | 176 High |
| LLC DOMODEDOVO AIRPORT HANDLING INN 5009096948 Moscow region |
-218,5 | 448,7 | 6 905,6 | 7 939,3 | 5,17 | 8,46 | 263 Medium |
| LLC DOMODEDOVO INTERNATIONAL AIRPORT INN 5009097148 Moscow region |
66,2 | -50,6 | 3 978,7 | 4 404,3 | 9,22 | -0,23 | 320 Adequate |
| Total for TOP-10 group of companies | -548,7 | 2 416,6 | 9 775,8 | 10 438,5 | |||
| Average value within TOP-10 group of companies | -54,9 | 241,7 | 977,6 | 1 043,8 | 25,88 | 32,59 | |
| Industry average value | -10,5 | 81,9 | 353,6 | 395,0 | 14,50 | 19,42 | |
In 2016 the average value of service profitability ratio in TOP-10 group of companies is higher than practical and industry average values. In 2016 four companies from TOP-10 list have values higher than practical value, five companies have values lower than practical value and one company (LLC DOMODEDOVO INTERNATIONAL AIRPORT) – has negative value of the ratio (green, orange and red color in column 6 and 7 of Table 1 and Picture 1 respectively).
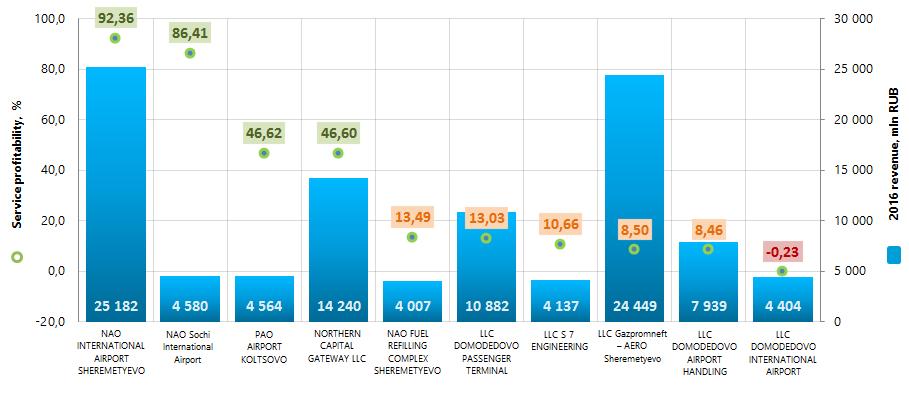 Picture 1. Service profitability ratio and revenue of the largest Russian air transport service companies (TOP-10)
For the last 10 years, the average values of service profitability ratio were lower than practical values (Picture 2). This may be a sign of unfavorable trends in the industry.
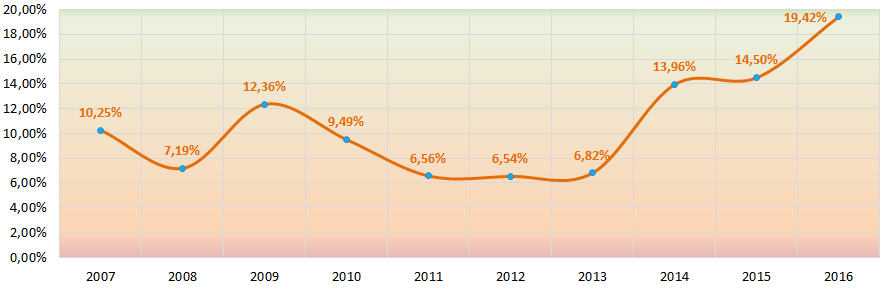 Picture 2. The change of service profitability ratio average values within 2007-2016 for the Russian air transport service companies
Nine companies from TOP-10 list have the upper levels of solvency index Globas, this fact shows the ability of the companies to meet their obligations in time and fully.
LLC DOMODEDOVO INTERNATIONAL AIRPORT has low level of solvency index Globas due to participation as a defendant in debt collection arbitration proceedings, unclosed enforcement lists and losses in balance figures. The forecast for index development is stable.