
Order a report
Custom-made industry research, company ratings, competitor analysis


Return on assets of collectors
Information agency Credinform has prepared a ranking of the Russian payment collection and credit information agencies. The largest enterprises (TOP-10 and TOP-100) in terms of annual revenue were selected according to the data from the Statistical Register and the Federal Tax Service for the available periods (2018-2020). Then the companies were ranged by return on assets ratio (Table 1). The analysis was based on the data from the Information and Analytical system Globas.
Return on assets (%) is calculated as the relation of the sum of net profit and interest payable to the total assets value of a company and shows how many monetary units of net profit are earned by every unit of total assets.
The ratio characterizes the effectiveness of using by the company of its resources. The higher is the ratio value, the more effective is business, that is the higher the return per every monetary unit invested in assets.
However, it is necessary to take into account that under the influence of inflation, the book value of fixed assets will increasingly be underestimated in time, that will lead to an overestimation of the return on assets. Thus, it is necessary to take into account not only the structure, but also the age of the assets.
It should be also taken into account the dynamics of this indicator. Its consistent decline indicates a drop in asset utilization.
The calculation of practical values of financial indicators, which might be considered as normal for a certain industry, has been developed and implemented in the Information and Analytical system Globas by the experts of Information Agency Credinform, taking into account the actual situation of the economy as a whole and the industries. In 2020, the practical value of return on assets ratio for the payment collection and credit information agencies is from 0,1 to 18,99 %%.
For the most full and fair opinion about the company’s financial position the whole set of financial indicators and ratios should be taken into account.
| Name, INN, region | Revenue, million RUB | Net profit (loss), million RUB | Return on assets, % | Solvency index Globas | |||
| 2019 | 2020 | 2019 | 2020 | 2019 | 2020 | ||
| 1 | 2 | 3 | 4 | 5 | 6 | 7 | 8 |
| LLC ACTIVEBUSINESSCONSULT INN 7736659589 Moscow |
|
|
|
|
|
|
152 Superior |
| LLC CREDITEXPRESS FINANCE INN 7707790885 Moscow |
|
|
|
|
|
|
206 Strong |
| JSC FIRST COLLECTION BUREAU INN 2723115222 Moscow |
|
|
|
|
|
|
131 Superior |
| LLC ID COLLECT INN 7730233723 Moscow |
|
|
|
|
|
|
262 Medium |
| LLC REGIONAL COLLECTION SERVICE INN 7707782563 Moscow |
|
|
|
|
|
|
232 Strong |
| LLC LEGAL CENTRE PARITET INN 7718931947 Moscow |
|
|
|
|
|
|
237 Strong |
| LLC NATSIONALNAYA FABRIKA IPOTEKI INN 7706450420 Moscow |
|
|
|
|
|
|
233 Strong |
| LLC SERIOUS TRADE INN 2801146767 Novosibirsk region |
|
|
|
|
|
|
266 Medium |
| NATIONAL RECOVERY SERVICE LLC INN 7727551797 Moscow |
|
|
|
|
|
|
248 Strong |
| LLC CAFT INN 7813286084 St. Petersburg |
|
|
|
|
|
|
234 Strong |
| Average value for TOP-10 companies | |
|
|
|
|
|
|
| Average value for TOP-100 companies | |
|
|
|
|
|
|
| Average industry value | |
|
|
|
|
|
|
![]() growth of indicator in comparison with prior period,
growth of indicator in comparison with prior period, ![]() decline of indicator in comparison with prior period
decline of indicator in comparison with prior period
In 2020, the average value of return on assets, TOP-10 and TOP-100 companies is in the range of practical value. In 2020, three companies reduced the results, while in 2019, the decline was observed in five companies. At the same time, seven companies showed the increase in revenue and nine companies demonstrated the increase in net profit.
The TOP-10 revenue increased on average by 11%, the TOP-100 revenue - by 13%, and the industry average ratio showed the decrease by 20%.
The TOP-10 profit increased by more than twice, the TOP-100 profit increased by 65%, and the average growth whithin the industry amounted to 20%.
Within the last five years, the average industry indicators of return on assets ratio twice decreased and grew from year to year. The ratio showed the best result in 2017 and the worst in 2016 (Picture 1).
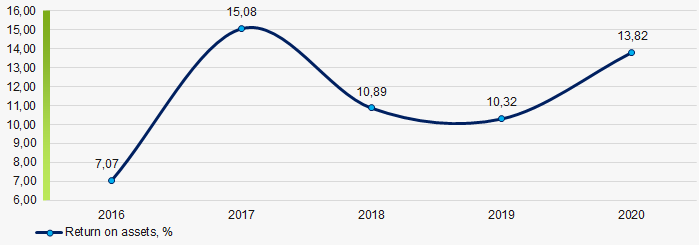 Рисунок 1. Change in average industry values of return on assets of the payment collection and credit information agencies in 2016 – 2020