
Order a report
Custom-made industry research, company ratings, competitor analysis


TOP-500 of systemically important companies
On March 20, the Government commission on improving the sustainability of the Russian economy approved a new List of systemically important companies, the financial condition of which must be monitored and, if necessary, provided with the state support under the crisis. The list includes 645 organizations in respect of which a ban has been introduced on the filing of bankruptcy applications by creditors from April 06, 2020 to 05 May, 2020.
Information agency Credinform has prepared a review of trends of the largest Russian systemically important companies.
The largest companies (TOP-500) in terms of annual revenue were selected for the analysis according to the data from the Statistical Register for the latest available periods (2013-2018). The analysis was based on the data of the Information and Analytical system Globas.
Net assets are total assets less total liabilities. This indicator reflects the real value of the property of an enterprise. When the company’s debt exceeds the value of its property, the indicator is considered negative (insufficiency of property).
The largest systemically important company in term of net assets is JSC GAZPROM, INN 7736050003, Moscow. In 2018, net assets value of the company exceeded 11 067 billion RUB.
The lowest net assets value among TOP-500 belonged to JSC UNITED CHEMICAL COMPANY URALCHEM, INN 7703647595, Moscow. In 2018, insufficiency of property of the company was indicated in negative value of -113 282 billion RUB.
Covering the five-year period, the average net assets values of TOP-500 companies have a trend to increase (Picture 1).
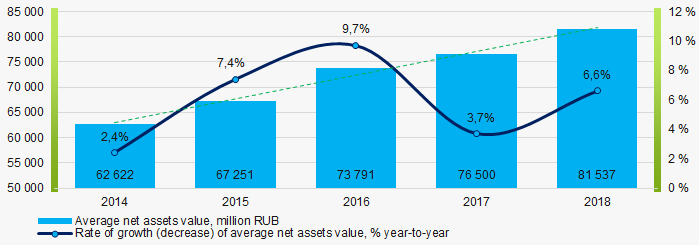 Picture 1. Change in average net assets value in 2014 – 2018
The shares of TOP-500 companies with insufficient property have trend to decrease over the past five years (Picture 2).
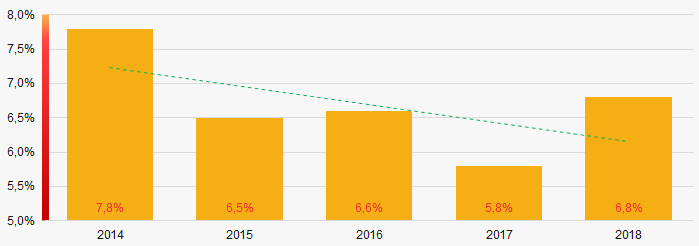 Picture 2. Shares of companies with negative net assets value in TOP-500
Sales revenue
In 2018, the revenue volume of 10 largest companies of the industry was almost 47% of total TOP-500 revenue (Picture 3). This is indicative of relatively high level of concentration of capital.
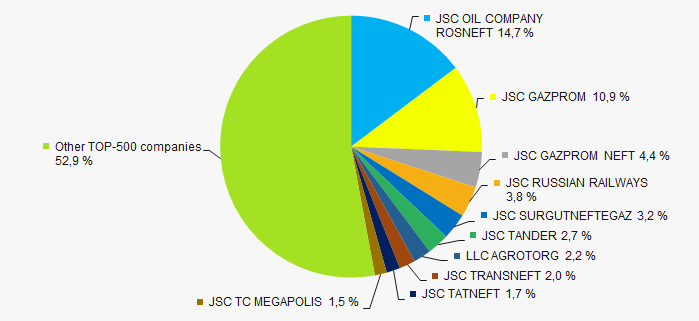 Picture 3. The share of TOP-10 companies in total 2018 revenue of TOP-500
 In general, there is a trend to increase in revenue (Picture 4).
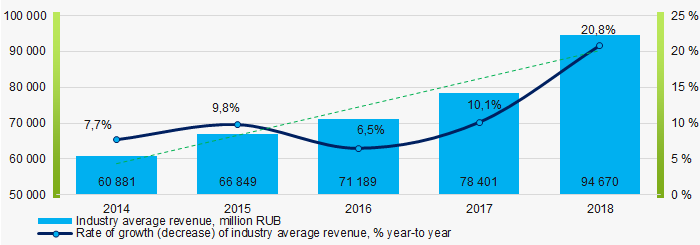 Picture 4. Change in industry average net profit in 2014-2018
Profit and loss
The largest company in term of net profit is JSC GAZPROM, INN 7736050003, Moscow. The company’s profit for 2018 amounted to 933 billion RUB.
Over the five-year period, there is a trend to increase in average net profit (Picture 5).
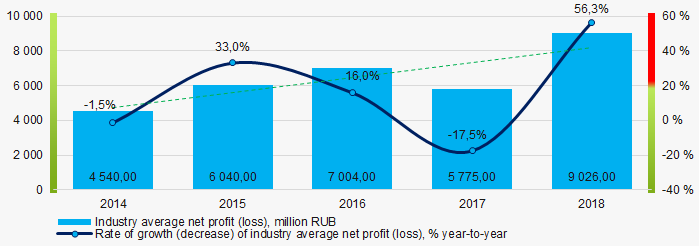 Picture 5. Change in industry average net profit (loss) values in 2014 – 2018
For the five-year period, the average net profit values of TOP-500 companies have a trend to increase with decreasing average net loss values (Picture 6).
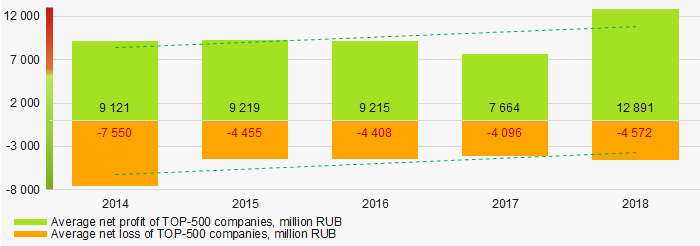 Picture 6. Change in average net profit and net loss of ТОP-500 in 2014 – 2018
Key financial ratios
For the five-year period, the average values of the current liquidity ratio were slightly above the recommended one - from 1,0 to 2,0 with a trend to decrease (Picture 7).
Current liquidity ratio (current assets to short-term liabilities) shows the sufficiency of company’s assets to repay on short-term liabilities.
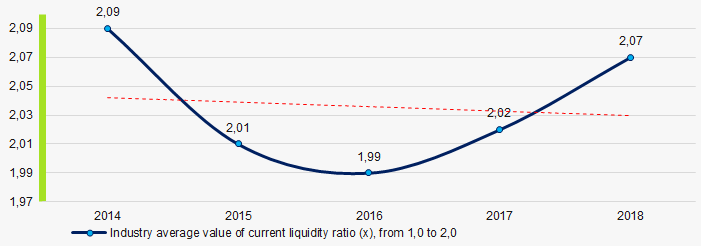 Picture 7. Change in industry average values of current liquidity ratio in 2014 – 2018
 For four out of five years, the average values of ROI ratio were relatively high with a trend to increase (Picture 8).
ROI ratio is calculated as net profit to sum of shareholders equity and long-term liabilities, and shows the return of equity involved in commercial activities and long-term borrowed funds.
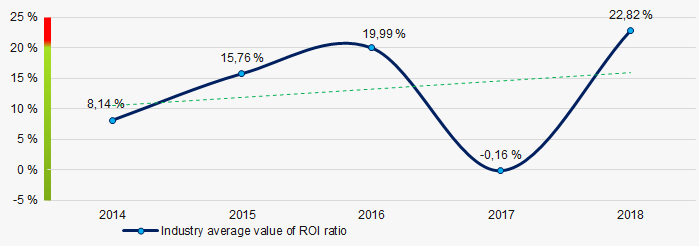 Picture 8. Change in average values of ROI ratio in 2014 – 2018
Assets turnover ratio is the ratio of sales revenue and company’s average total assets for a period. It characterizes the effectiveness of using of all available resources, regardless the source of their attraction. The ratio shows how many times per year the full cycle of production and circulation is performed, generating the corresponding effect in the form of profit.
For the five-year period, business activity ratio demonstrated the increasing trend (Picture 9).
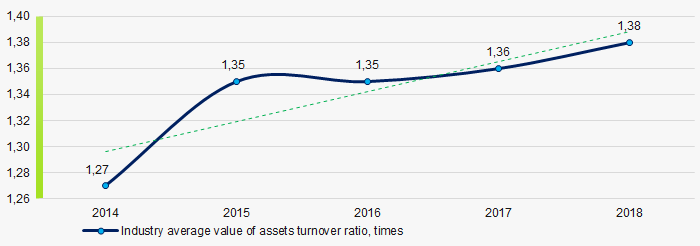 Picture 9. Change in average values of assets turnover ratio in 2014 – 2018
Small business
Systemically important companies included in TOP-500 are not registered in the Register of small and medium-sized enterprises of the Federal Tax Service of the Russian Federation.
Main regions of activity
Companies of TOP-500 are registered in 63 regions of Russia, and unequally located across the country. 60% of companies largest by revenue are located in Moscow and Saint Petersburg (Picture 10).
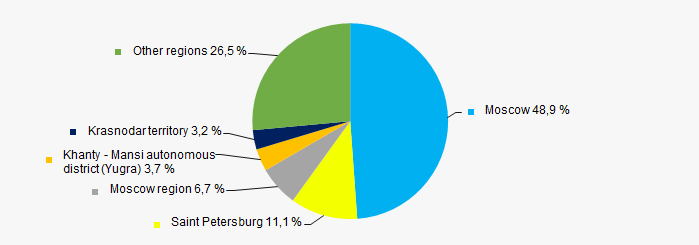 Picture 10. Distribution of TOP-1500 revenue by regions of Russia
Financial position score
Assessment of the financial position of TOP-500 companies shows that the majority of them have financial position above average (Picture 11).
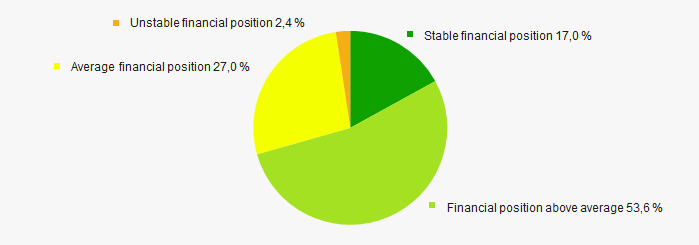 Picture 11. Distribution of TOP-500 companies by financial position score
Solvency index Globas
Most of TOP-500 companies got Superior / High and Strong / Medium index Globas. This fact shows their ability to meet their obligations fully (Picture 12).
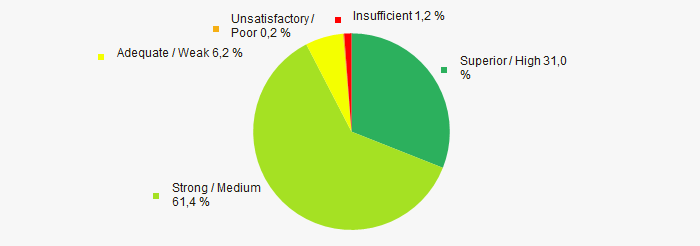 Picture 12. Distribution of TOP-500 companies by solvency index Globas
Conclusion
Complex assessment of activity of the largest Russian systemically important companies, taking into account the main indexes, financial ratios and indicators, demonstrates the prevalence of positive trends (Table 1).
| Trends and evaluation factors | Relative share of factors, % |
| Rate of growth (decline) in the average size of net assets | |
| Increase / decrease in the share of enterprises with negative values of net assets | |
| Level of competition / monopolization | |
| Rate of growth (decline) in the average size of revenue | |
| Rate of growth (decline) in the average size of profit (loss) | |
| Growth / decline in average values of companies’ net profit | |
| Growth / decline in average values of companies’ net loss | |
| Increase / decrease in average values of total liquidity ratio | |
| Increase / decrease in average values of return on investment ratio | |
| Increase / decrease in average values of asset turnover ratio, times | |
| Regional concentration | |
| Financial position (the largest share) | |
| Solvency index Globas (the largest share) | |
| Average value of relative share of factors | |
![]() positive trend (factor),
positive trend (factor), ![]() negative trend (factor).
negative trend (factor).