
Order a report
Custom-made industry research, company ratings, competitor analysis


Mechanic engineering companies in Nizhniy Novgorod
Information agency Credinform represents a ranking of the largest mechanic engineering companies in Nizhniy Novgorod. Companies engaged in manufacture of machinery, equipment and vehicles with the largest volume of annual revenue (TOP 10 and TOP 100) were selected for the ranking, according to the data from the Statistical Register and the Federal Tax Service for the latest available periods (2018 - 2020). They were ranked by the solvency ratio (Table 1). The selection and analysis were based on the data of the Information and Analytical system Globas.
Solvency ratio (х) is a ratio of equity to total assets. The ratio shows the dependence of the company on external loans. Recommended value: > 0.5.
The ratio reflects the rate of turnover of equity capital. A high value of the ratio indicates the efficient use of own funds, and a low value - about the inaction of a part of own funds.
For the most complete and objective view of the financial condition of the enterprise, it is necessary to pay attention to the complex of indicators and financial ratios of the company.
| Name, INN, activity | Revenue, million RUB | Net profit (loss), million RUB | Solvency ratio (x), >0,5 | Solvency index Globas | |||
| 2019 | 2020 | 2019 | 2020 | 2019 | 2020 | ||
| 1 | 2 | 3 | 4 | 5 | 6 | 7 | 8 |
| LLC LIR INN 5256029449 manufacture of other components and accessories for motor vehicles |
|
|
|
|
|
|
177 High |
| JSC JSC HYDROMASH INN 5262008630 manufacture of parts and components for aircraft and spacecraft |
|
|
|
|
|
|
218 Strong |
| JSC MAGNA AUTOMOTIVE RUS INN 5256076921 manufacture of other components and accessories for motor vehicles |
|
|
|
|
|
|
141 Superior |
| JSC KRASNOE SORMOVO PLANT INN 5263006629 construction of ships, vessels and floating structures |
|
|
|
|
|
|
181 High |
| LLC PRODUCTION AND COMMERCIAL COMPANY LUIDOR INN 5257065753 manufacture of buses and trolleybuses |
|
|
|
|
|
|
236 Strong |
| JSC GAZ INN 5200000046 manufacture of other components and accessories for motor vehicles |
|
|
|
|
|
|
220 Strong |
| LLC NIZHEGORODSKIE MOTORY INN 5256067300 manufacture of other components and accessories for motor vehicles |
|
|
|
|
|
|
289 Medium |
| LLC ST NIZHEGORODETS INN 5259062324 manufacture of motor vehicles |
|
|
|
|
|
|
239 Strong |
| LLC AUTOMOBILE PLANT GAZ INN 5250018433 manufacture of motor vehicles |
|
|
|
|
|
|
259 Medium |
| JSC PRODUCTION COMPANY AVTOKOMPONENT NIZHNIY NOVGOROD INN 5256087440 manufacture of electrical and electronic equipment for motor vehicles |
|
|
|
|
|
|
309 Adequate |
| Average value for TOP 10 | |
|
|
|
|
|
|
| Average value for TOP 100 | |
|
|
|
|
|
|
![]() growth of indicator to the previous period,
growth of indicator to the previous period, ![]() fall of indicator to the previous period
fall of indicator to the previous period
The average values of the solvency ratio of TOP 10 and TOP 100 are above the industry average and below the recommended ones.
Only three companies of TOP 10 increased their figures in 2020 compared to 2019. In 2019, the growth was recorded for seven companies.
In 2020, seven companies included in TOP 10 reduced revenue and six companies reduced net profit. The average revenue fell 8% and 6% for TOP 10 and TOP 100 respectively. The average profit of TOP 10 and TOP 100 fell 7 times and almost 3 times respectively.
Over the past five years, the growths of the industry average values of the solvency ratio was recorded only for one period. The highest value was recorded in 2016 and the lowest one was in 2018 (Picture 1).
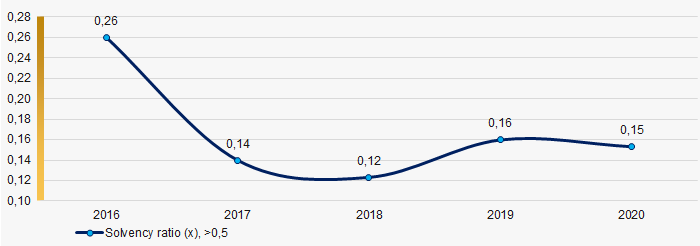 Picture 1. Change in the industry average values of the solvency ratio of the mechanic engineering companies in Nizhniy Novgorod in 2016 - 2020