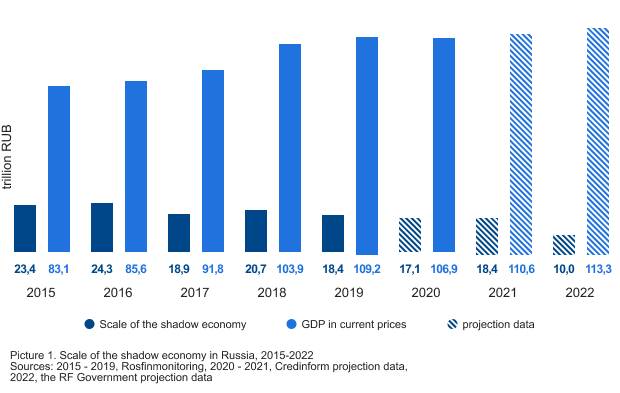
The shadow sector of the Russian economy has been shrinking over the past few years. By 2022, the Government of the Russian Federation predicts a decrease in the volume of the shadow economy to 10 trillion RUB, about 9% of the forecasted value of GDP for 2022. For comparison, the total revenue of the three largest enterprises in Russia in 2020 is 10,7 trillion RUB - JSC Gazprom (4,1 trillion RUB), JSC Oil Company Rosneft (4,8 trillion RUB), JSC Russian Railways (1,8 trillion RUB).
Does the Russian economy have a chance to step out of the shade?
The shadow sector exists in the economy of any country. Tax evasion, criminal income, understatement of the size of business take place even in financially prosperous states. The scale of the shadow economy is crucial. The greater its share in GDP and the citizens employed in it, the less budget revenues, the weaker the economy, and the higher the risks of economic security.
How big is the Russia’s shadow economy?
Despite the downward trend, the volume of the hidden economy in Russia is quite large. According to the Federal Service for Financial Monitoring of the Russian Federation (Rosfinmonitoring), the shadow sector is estimated at about 18,4 trillion RUB, 16,9% of Russia's GDP (Picture 1). The volume of shadow activity in the Russian Federation is practically comparable to the federal budget revenues. In particular, revenues amounted to about 20,3 trillion RUB in 2020.
In 2015-2017, the growth of the gray economy stopped and its share in total GDP began to decline. Russian business has adapted to the sanctions, and domestic production has been adjusted within the framework of the import substitution policy. However, in 2018, the next round of the crisis brought tangible discomfort to a number of the country's leading industries, provoked an outflow of foreign assets from Russia and the growth the share of the shadow economy.

Prospects to step out of the shade
The measures taken by the Government for deoffshorization, combating illegal income, and control over monetary transactions are yielding positive results. According to the Central Bank, the volume of shady transactions in the banking sector in 2020 decreased by 26%, which will undoubtedly affect the “lightness” of the economy.
According to Credinform experts, the share of the shadow economy will decrease due to the growth of Russia's GDP, but its volume will remain quite high: in 2021, it may return to the value of 2019, reaching 18,4 trillion RUB. (Picture 1).
Forced restriction of business activity in 2020-2021 negatively affected a number of industries in Russia. The increase in additional employee costs during the period of restrictions prompted many entrepreneurs to go into the shadows and conduct uncontrolled economic activities.
Reducing the shadow sector depends on a competent solution to the problems of Russian entrepreneurs, not only tightening measures against unreliable and shell companies, but also stimulating business development, including through a fair reduction in the tax burden.
Information agency Credinform represents a ranking of the largest metallurgical companies in Chelyabinsk. Companies engaged in smelting of ferrous and non-ferrous metals, alloys, as well as the production of finished metal products with the largest volume of annual revenue (TOP 10 and TOP 100) were selected for the ranking, according to the data from the Statistical Register and the Federal Tax Service for the latest available periods (2018 - 2020). They were ranked by the solvency ratio (Table 1). The selection and analysis were based on the data of the Information and Analytical system Globas.
Credit period (days) is calculated as the ratio of the average amount of accounts payable for the period to sales revenue. The ratio shows how many days during the year the company repaid the average amount of its accounts payable.
The indicator reflects the process of repayment of debts to counterparties and is calculated to assess cash flows, which makes it possible to draw conclusions about the efficiency of the company and the chosen financial strategy.
The lower the indicator, the faster the company settles with its suppliers. Increased turnover can mean both problems with paying invoices and better organizing relationships with suppliers, providing more profitable, deferred payment schedule and using accounts payable as a source of cheap financial resources.
For the most complete and objective view of the financial condition of the enterprise, it is necessary to pay attention to the complex of indicators and financial ratios of the company.
Name, INN, activity | Revenue, billion RUB | Net profit (loss), million RUB | Credit period, days | Solvency index Globas | |||
2019 | 2020 | 2019 | 2020 | 2019 | 2020 | ||
1 | 2 | 3 | 4 | 5 | 6 | 7 | 8 |
LLC PRODUCTION AND COMMERCIAL FIRM INSSTAL INN 7411018984 zink production |
![]() |
![]() |
![]() |
![]() |
![]() |
![]() |
212 Strong |
JSC CHELYABINSK ELECTROMETALLURGICAL PLANT INN 7447010227 ferroalloys production |
![]() |
![]() |
![]() |
![]() |
![]() |
![]() |
196 High |
JSC CHELYABINSK ZINK PLANT INN 7448000013 production of lead, zinc and tin |
![]() |
![]() |
![]() |
![]() |
![]() |
![]() |
170 Superior |
JSC CHELYABINSK PROFILED STEEL FLOORING PLANT INN 7447014976 production of building metal structures, products and their parts |
![]() |
![]() |
![]() |
![]() |
![]() |
![]() |
204 Strong |
LLC BVK INN 7449106598 steel casting |
![]() |
![]() |
![]() |
![]() |
![]() |
![]() |
247 Strong |
JSC CHELYABINSK METALLURGICAL PLANT INN 7450001007 production of cast iron, steel and ferroalloys |
![]() |
![]() |
![]() |
![]() |
![]() |
![]() |
400 Weak |
JSC CHELYABINSKAVTOREMONT INN 7452032145 mechanical processing of metal products |
![]() |
![]() |
![]() |
![]() |
![]() |
![]() |
195 High |
JSC KONAR INN 7451064592 mechanical processing of metal products |
![]() |
![]() |
![]() |
![]() |
![]() |
![]() |
225 Strong |
JSC CHELYABINSK TUBE ROLLING PLANT INN 7449006730 production of steel pipes, hollow sections and fittings |
![]() |
![]() |
![]() |
![]() |
![]() |
![]() |
203 Strong |
JSC CHELYABINSK STEEL STRUCTURE PLANT INN 7449010952 production of building metal structures, products and their parts |
![]() |
![]() |
![]() |
![]() |
![]() |
![]() |
230 Strong |
Average value for TOP 10 | ![]() |
![]() |
![]() |
![]() |
![]() |
![]() |
|
Average value for TOP 100 | ![]() |
![]() |
![]() |
![]() |
![]() |
![]() |
growth of indicator to the previous period,
fall of indicator to the previous period
The average values of credit period of TOP 10 and TOP 100 were below the industry average ones.
Only four companies of TOP 10 increased their figures in 2020 compared to 2019. In 2019, the growth was recorded for seven companies.
In 2020, six companies included in TOP 10 gained revenue and four companies gained net profit. A 13% and 12% fell of the average revenue was recorded for TOP 10 and TOP 100 respectively. The average profit of TOP 10 and TOP 100 fell 45% and 43% respectively.
Over the past five years, the average values of credit period have increased constantly (Picture 1).
