Statistical accounting reform
As a part of the national program «Digital economy» project of the Decree of the Government of Russia «Regulation on Digital analytical platform for providing statistical data» was prepared and presented for consideration.
The aim of founding Digital analytical platform (DAP) is automation of production and distribution process of statistical data. DAP is presented by developers as complex of information, technology, legal and methodological support means.
It is expected that in the process of introduction of the platform accounting load on respondents will be decreased and budget costs on statistical data production will be minimized, users of the platform will be satisfied with statistical data and its` distribution volume will increase. Statistical data services will be more available and convenient. The Federal State Statistics Service (Rosstat) is defined as operator of the platform.
Operation of the platform should provide all users with:
- momentariness of data provision (incl. statistical) online to all governmental authorities and local government;
- possibility to build and use analytical indicators (incl. traditional statistical) for governmental control, using available primary statistical data base considering changing information requirements;
- provision of all data, both by respondents and user requests, only in electronic machine-readable form;
- simultaneous usage of data of different origin on a real-time basis (e.g., data of statistical census and inquiries, accounts to state authorities, alternative and open information sources), that allows to control process of economic management on the basis of complete information;
- integration of financial, statistical and tax accounts;
- possibility to upload by respondents via “one-stop window” different types of accounts, integrated with platforms and information systems of the authorities of executive power and local self-government.
The following stages of development and introduction of DAP are expected:
| Year | Stage |
| 2019 | One-stop window |
| 2020 - 2023 | Unified register of statistical forms and indicators Unified register of respondents Automated information system of the Federal plan of statistical works |
| 2021 - 2023 | Unified statistical data storage |
| 2024 | Unified technology for data collection, processing and analyze Switch to stream data collection |
Manufacturing sector of the Central federal district
Information agency Credinform has prepared a review of trends of the largest manufacturers in the Central federal district of Russia.
The largest manufacturers (TOP-1000) in terms of annual revenue were selected for the analysis according to the data from the Statistical Register for the latest available periods (2013-2018). The analysis was based on the data of the Information and Analytical system Globas.
Net assets are total assets less total liabilities. This indicator reflects the real value of the property of an enterprise. When the company’s debt exceeds the value of its property, the indicator is considered negative (insufficiency of property).
The largest company in term of net assets is JSC NOVOLIPETSK STEEL, INN 4823006703. In 2018, net assets value of the company exceeded 336 billion RUB.
The lowest net assets volume among TOP-1000 belonged to JSC UNITED CHEMICAL COMPANY URALCHEM/ URALCHEM, INN 7703647595. In 2018, insufficiency of property of the company was indicated in negative value of -113,3 billion RUB.
Covering the five-year period, the average net assets values of TOP-1000 companies have a trend to increase (Picture 1).
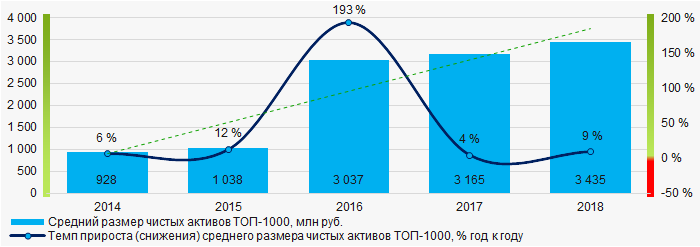 Picture 1. Change in average net assets value in 2014 – 2018
The shares of TOP-1000 companies with insufficient property have trend to decrease over the past five years (Picture 2).
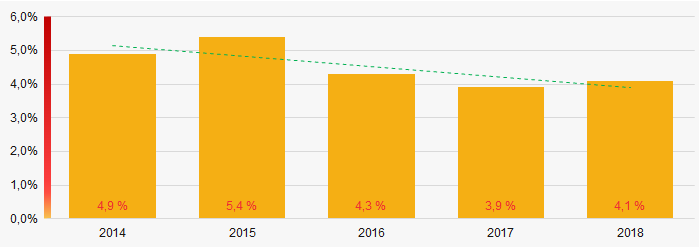 Picture 2. Shares of companies with negative net assets value in TOP-1000
Sales revenue
In 2018, total revenue of 10 largest companies was almost 22% of TOP-1000 total revenue (Picture 3). This testifies relatively low concentration of manufacturers in the Central region.
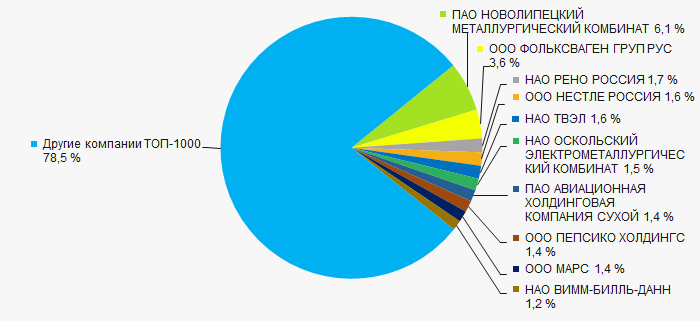 Picture 3. Shares of TOP-10 companies in TOP-1000 total profit for 2018
In general, there is an increase in revenue (Picture 4).
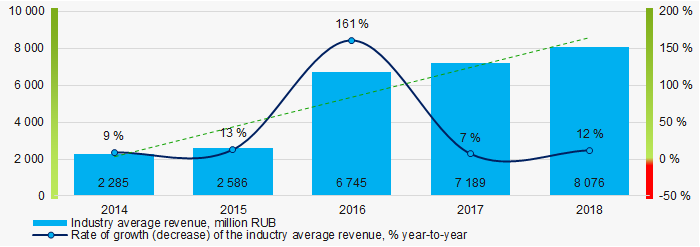 Picture 4. Change in industry average net profit in 2014-2018
Profit and loss
The largest company in term of net profit is JSC NOVOLIPETSK STEEL, INN 4823006703. The company’s profit for 2018 amounted to 117,9 billion RUB.
Over the five-year period, there is a trend to increase in average net profit of TOP-1000 companies (Picture 5).
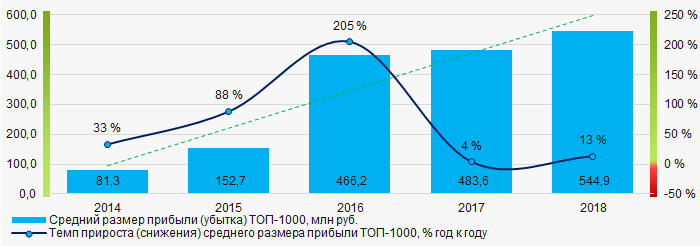 Picture 5. Change in industry average net profit values in 2014-2018
For the five-year period, the average net profit values of TOP-1000 companies increase with the average net loss value also having the increasing trend (Picture 6).
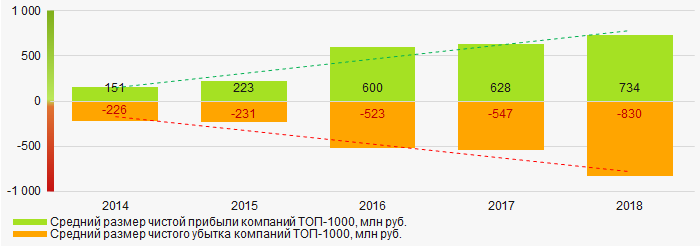 Picture 6. Change in average net profit and net loss of ТОP-1000 in 2014 – 2018
Key financial ratios
For the five-year period, the average values of the current liquidity ratio were above the recommended one - from 1,0 to 2,0 with a trend to increase (Picture 7).
Current liquidity ratio (current assets to short-term liabilities) shows the sufficiency of company’s assets to repay on short-term liabilities.
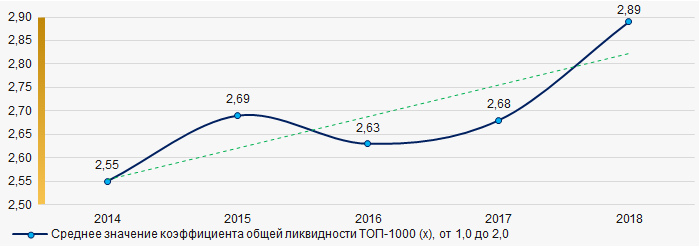 Picture 7. Change in industry average values of current liquidity ratio in 2014 – 2018
For the five-year period, the average values of ROI ratio were on a high level with a trend to increase (Picture 8).
ROI ratio is calculated as net profit to sum of shareholders equity and long-term liabilities, and shows the return of equity involved in commercial activities and long-term borrowed funds.
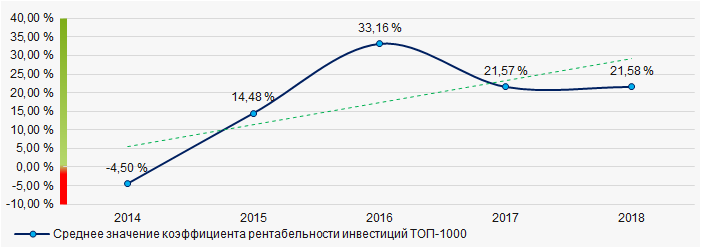 Picture 8. Change in average values of ROI ratio in 2014 – 2018
Assets turnover ratio is the ratio of sales revenue and company’s average total assets for a period. It characterizes the effectiveness of using of all available resources, regardless the source of their attraction. The ratio shows how many times per year the full cycle of production and circulation is performed, generating the corresponding effect in the form of profit.
For the five-year period, business activity ratio demonstrated the decreasing trend (Picture 9).
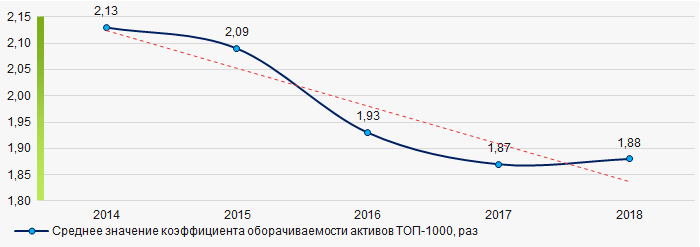 Picture 9. Change in average values of assets turnover ratio in 2014 – 2018
Small enterprises
Only 8% companies of TOP-1000 are registered in the Register of small and medium-sized enterprises of the Federal Tax Service of the Russian Federation. At the same time, their share in total revenue of TOP-1000 companies amounted to 1,7% that is significantly lower than the national average figure (Picture 10).
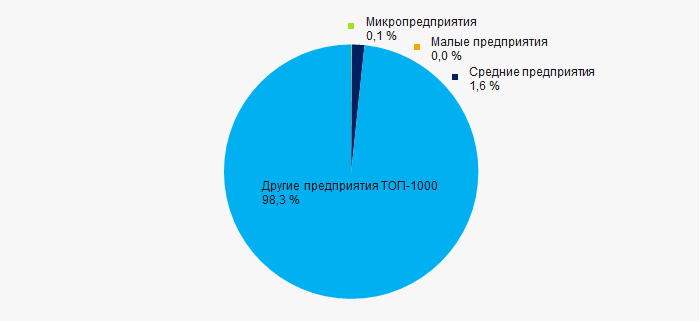 Picture 10. Shares of small and medium-sized enterprises in TOP-100, %
Main regions of activity
Companies of TOP-1000 are registered in 18 regions of Russia and located across the federal district quite unequally. Almost 54% of companies largest by revenue are located in Moscow and Moscow region (Picture 11).
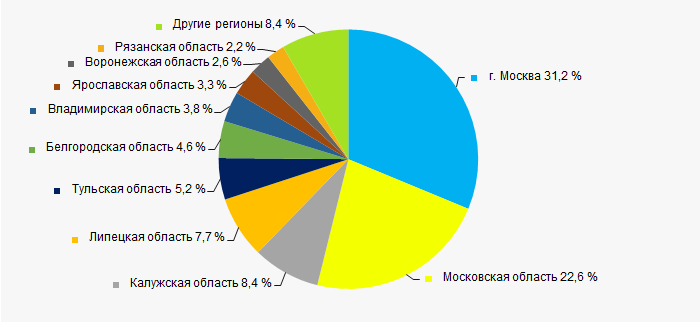 Picture 11. Distribution of TOP-100 revenue by regions of the Central federal district
Financial position score
Assessment of the financial position of TOP-1000 companies shows that the majority of them have financial position above average (Picture 12).
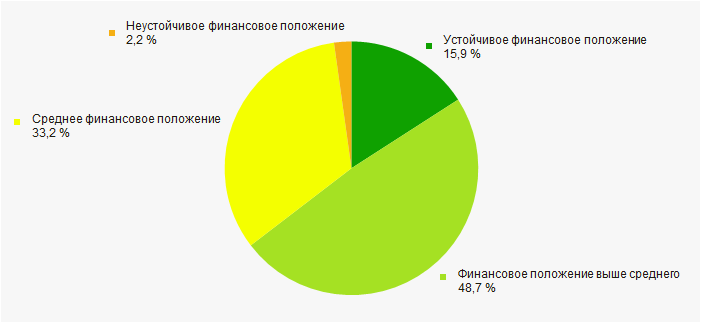 Picture 12. Distribution of TOP-1000 companies by financial position score
Solvency index Глобас
Most of TOP-1000 companies got Superior / High and Strong / Medium index Глобас. This fact shows their ability to meet their obligations fully (Picture 13).
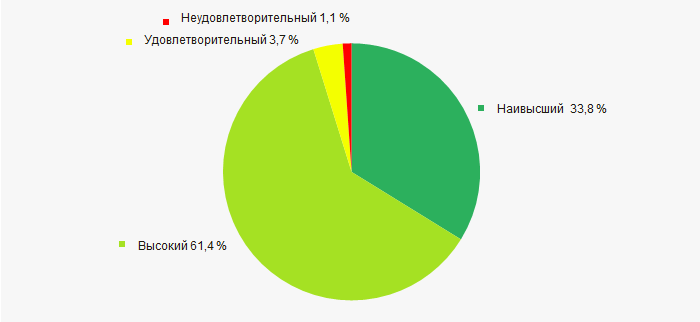 Picture 13. Distribution of TOP-1000 companies by solvency index Globas
Index of industrial production
According to the Federal State Statistics Service (Rosstat), during 12 months of 2018-2019, there is a trend to increase of industrial production index in the Central federal district. (Picture 14). At the same time, the average month-to-month value of the index is 102,9%.
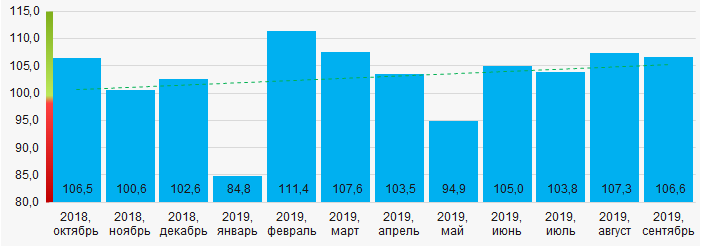 Picture 14. Index of industrial production in manufacturing sector of the Central federal district in 2018-2019, month-to-month (%)
Conclusion<br/Complex assessment of activity of the largest manufacturers of the Central federal district, taking into account the main indexes, financial ratios and indicators, demonstrates the prevalence of positive trends (Table 1).
| Trends and evaluation factors | Relative share of factors, % |
| Rate of growth (decline) in the average size of net assets |  10 10 |
| Increase / decrease in the share of enterprises with negative values of net assets |  10 10 |
| Rate of growth (decline) in the average size of revenue |  10 10 |
| Level of competition |  10 10 |
| Rate of growth (decline) in the average size of profit (loss) |  10 10 |
| Growth / decline in average values of companies’ net profit |  10 10 |
| Growth / decline in average values of companies’ net loss |  -10 -10 |
| Increase / decrease in average values of total liquidity ratio |  5 5 |
| Increase / decrease in average values of return on investment ratio |  10 10 |
| Increase / decrease in average values of asset turnover ratio, times |  -10 -10 |
| Share of small and medium-sized businesses in the region in terms of revenue being more than 22% |  -10 -10 |
| Regional concentration |  -10 -10 |
| Financial position (the largest share) |  10 10 |
| Solvency index Globas (the largest share) |  10 10 |
| Average value of relative share of factors |  10 10 |
| Rate of growth (decline) in the average size of net assets |  4,3 4,3 |
 positive trend (factor),
  negative trend (factor).