
Order a report
Custom-made industry research, company ratings, competitor analysis


Domestic demand will promote the economy growth
Having showed the promising results in spring when industrial production index reached a maximum value of 5.6% since February 2012, in June-July the manufacturing industry in Russia demonstrated decrease. If in June the index of 3,5% was recorded, in July it was reduced to 1,1% (see Picture 1).
Increase of index can be explained with unusually cold weather in most of the European territory of the country that led to extension of the heating season and increase in demand on energy consumption. The fact of 1 working day more in May of 2017 against the previous year also played a role in positive cumulative effect. In June, the effect of the seasonal and calendar factors has stopped and it became obvious that the economy would not maintain high growth rates. The decline occurred in all sectors, however, it should be noted that among the sectors that have maintained a positive growth dynamics, there are not only raw materials, but also production of consumer goods.
Currently the industry could be supported not so much with export as with domestic demand. Under otherwise equal conditions the growing domestic consumption stimulates the increasing of goods output.
Strengthening of the ruble in the first half of 2017 led to import growth on 27% in US dollar terms. That was resulted in revival of retail business and manufacturing activity being a part of transnational brands – auto industry, electronics, etc.
However after a new wave of domestic currency weakening in August, the number of sectors has heavy expenses again: in Russia there are no analogues of needed equipment and materials or they just don’t meet current standards of quality and efficiency. Import substitution program launched by the Government is not able to reduce the lag in technology at short notice.
Conservative policy of the Central Bank aiming at struggle against price boost gives discrepant results – informing about successful achievement of the minimal inflation level ever, the Bank too carefully manages the reduction of rates thereby limiting the access to low-interest credit for business and citizens. Artificial limitation of money stock is resulted in nothing but economic stagnation.
Real income of population being decreased for three consecutive years takes a toll on domestic consumption: in 2014 they reduced on 0,7%; in 2015 – on 3,2%; in 2016 – on 5,9%; in January-July 2017 – on 1,4% (Income net of all obligatory payments and taxes adjusted for inflation).
Only export-oriented mineral companies, food industry enterprises, as well as companies rapidly crossed over to other suppliers, including from the RF, had the benefit.
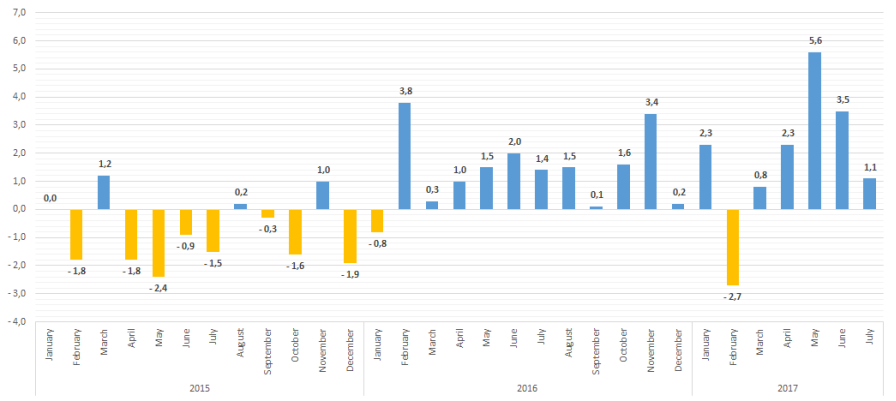 Picture 1. Dynamics of industrial production in Russia, % to the relevant month of the previous year
Table 1 contains information about industrial production by key industries in July 2017 (to July 2016) and January-July 2017 (to the same period of 2016).
Following the results of July 2017, the processing sector demonstrates increase in furniture production – on 11,2%, pharmaceuticals – on 10,1%, food products – on 8,4%, finished goods – on 8,1%, textile – on 7,7%. At the same time, output of other vehicles (buses, trains, etc.) decreased on 33,3%, cigarettes and tobacco – on 16,5%, printing products – on 9%.
Comparing the dynamics of industrial production index for January-July 2017, the auto industry appeared to be a leader with increase on 11,7% despite of decrease in shipments from factories on 0,5% (against July 2016). Car market will likely resume its growth bypassing monthly recession. Automobile construction is one of the key indicators of the development of consumer confidence and economic recovery because only under stability the population begins to purchase goods of deferred demand.
| INDUSTRY BY OKVED2 (the Russian Standard Industrial Classification of Economic Activities) | INCREASE (DECREASE), July 2017 to July 2016, % | INCREASE (DECREASE), January-July 2017 to January-July 2016, % |
| INDUSTRIAL PRODUCTION IN GENERAL | 1,1 | 1,8 |
| MINING | 4,0 | 3,2 |
| Other minerals mining | 15,1 | 8,3 |
| Provision of services related to mining | 18,4 | 8,2 |
| Mining of coal | 7,1 | 4,1 |
| Mining of metal ores | 0,3 | 3,8 |
| Mining of crude oil and natural gas | 1,3 | 2,2 |
| MANUFACTURING | -0,8 | 0,9 |
| Manufacture of motor vehicles, trailers and semi-trailers | -0,5 | 11,7 |
| Manufacture of pharmaceutical products and medical devices | 10,1 | 11,1 |
| Manufacture of furniture | 11,2 | 8,5 |
| Manufacture of paper and paper products | 5,0 | 6,9 |
| Manufacture of textile products | 7,7 | 6,5 |
| Manufacture of chemicals and chemical products | 0,9 | 6,5 |
| Manufacture of electrical equipment | 1,5 | 6,0 |
| Manufacture of leather and leather products | -1,2 | 5,2 |
| Manufacture of clothes | -3,1 | 5,0 |
| Manufacture of food products | 8,4 | 4,4 |
| Manufacture of rubber and plastic products | -1,1 | 4,2 |
| Manufacture of wood and products of wood and cork | 1,5 | 2,5 |
| Manufacture of other non-metallic mineral products | 2,0 | 2,3 |
| Manufacture of machinery and equipment | 0,4 | 1,8 |
| Manufacture of coke and petroleum products | 3,5 | 0,9 |
| Manufacture of other finished goods | 8,1 | -1,0 |
| Repair and maintenance of machinery and equipment | -1,5 | -1,8 |
| Manufacture of beverages | -8,3 | -2,2 |
| Manufacture of computers, electronic and optical products | -6,6 | -2,4 |
| Manufacture of other motor-vehicles and equipment | -33,3 | -3,3 |
| Manufacture of fabricated metal products | 1,5 | -3,4 |
| Metal industry | -4,5 | -5,1 |
| Printing and copying recorded media | -9,0 | -7,5 |
| Manufacture of tobacco products | -16,5 | -21,4 |
| DISTRIBUTION OF ELECTRICITY, GAS, STEAM | 0,1 | 2,1 |
| WATER SUPPLY, WATER DISPOSAL, WASTE DISPOSAL | -4,0 | -2,2 |
Release of recent statistics on production in August and September will indicate whether the Russian production sector has gone into stagnation.
Continuing external sanctions pressure, transaction with OPEC binding Russia to reduce the exploitation rate for stabilization of the world market, increased volatility of the ruble also introduced additional risks into long-term business planning.
Despite the difficulties, the GDP growth in April-June 2017 in the annual comparison turned out to be the maximum for the last 19 quarters (from III quarter of 2012). Preliminary assessment of the GDP dynamics for II quarter was 2,5%. With the exception of seasonality, it can be stated that the Russian economy is growing for the fifth consecutive quarter, having passed the bottom of compression in early 2016.