
Order a report
Custom-made industry research, company ratings, competitor analysis


Solvency ratio of public catering companies
Information agency Credinform has prepared a ranking of the largest Russian public catering companies. The largest enterprises (TOP-10) in terms of annual revenue were selected according to the data from the Statistical Register for the available periods (2006-2011). Then the companies were ranged by solvency ratio (Table 1). The analysis was based on the data from the Information and Analytical system Globas.
Solvency ratio (х) is calculated as a ratio of equity capital to total balance. The ratio shows the company’s dependence from external borrowings. The recommended value of the ratio is >0,5.
The ratio value less than minimum limit signifies about strong dependence from external sources of funds; such dependence may lead to liquidity crisis, unstable financial position in case of deterioration in market conditions.
For the most full and fair opinion about the company’s financial position the whole set of financial indicators and ratios should be taken into account.
| Name, INN, region, trademark | Revenue, million RUB | Net profit (loss), million RUB | Solvency ratio (x), >0,5 | Solvency index Globas 2020 | |||
| 2009 | 2011 | 2009 | 2011 | 2009 | 2011 | ||
| 1 | 2 | 3 | 4 | 5 | 6 | 7 | 8 |
| JSC MOSCOW-MCDONALD'S INN 7710044132 Moscow (MCDONALDS, HAPPY MEAL, BIG MAC, Quarter Pounder, Filet-O-Fish, MCHAPPY PLACE, ROYAL CHEESEBURGER, MCCAFE, Big Tasty) |
|
|
|
|
|
|
155 Superior |
| LLC MCDONALD'S INN 7710044140 Moscow |
|
|
|
|
|
|
176 High |
| LLC FASTLAND INN 7703234453 Moscow (MU-MU) |
|
|
|
|
|
|
239 Strong |
| JSC AEROMAR INN 7712045131 Moscow region (SKYSERVICE, AEROMAR) |
|
|
|
|
|
|
164 Superior |
| LLC SODEXO EUROASIA INN 7722267655 Moscow |
|
|
|
|
|
|
285 Medium |
| LLC AMREST INN 7825335145 St. Petersburg (Pizza Hut, KFC) |
|
|
|
|
|
|
238 Strong |
| LLC ROSINTER RESTORANTS INN 7737115648 Moscow (SHIKARI, COSTACOFFEE, ROSINTER RESTORANTS HONORED GUEST, PLANETA SUSHI, PATIO, PLANETA VOSTOK) |
|
|
|
|
|
|
208 Strong |
| LLC COFFEE HOUSE INN 7704207300 Moscow |
|
|
|
|
|
|
302 Adequate |
| JSC KOMBINAT DOSHKOLNOGO PITANIYA INN 7726221073 Moscow |
|
|
|
|
|
|
170 Superior |
| LLC MOSKOVSKII SHKOLNIK INN 7713213445 Moscow |
|
|
|
|
|
|
221 Strong |
| Average value for TOP-10 companies | |
|
|
|
|
|
|
| Average industry value | |
|
|
|
|
|
|
![]() growth of indicator in comparison with prior period,
growth of indicator in comparison with prior period, ![]() decline of indicator in comparison with prior period
decline of indicator in comparison with prior period
The average value of solvency ratio of TOP-10 companies is lower than ТОP-1000 value. Three companies have the ratio higher than the recommended value and four companies improved the results in 2011 in comparison with 2009.
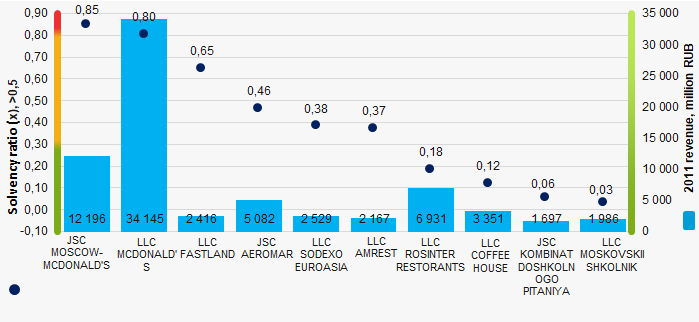 Picture 1. Solvency ratio and revenue of the largest Russian public catering companies (ТОP-10)
Within 5 years, the average values of solvency ratio of TOP-1000 are below the recommended value with a slight upward trend (Picture 2).
 Picture 2. Change in average values of solvency ratio of TOP-1000 Russian public catering companies in 2006 – 2011