Russia's banking system is being tested for durability
Today, the Russia's banking system experiences all the difficulties, which are facing the Russian economy: the decline in GDP and industrial production, devaluation of ruble, restrictions of capital on the Western market within the sanctions entered, a high level of the key rate of the Central Bank of the RF (10,5% from 14.06.2016), the decrease in real incomes of the population - all this has led not only to the slowdown of crediting, but also to an increase in overdue payments on loans.
The total amount of overdue loan debt of all legal entities and individual entrepreneurs to banks reached 1,8 trillion RUB as of May 1, 2016, that is 8,4% of the total debt on granted loans (21,4 trillion RUB) - it is close to the maximum value of 8,5%, which was fixed by the CB of the RF quite recently, in March 2016.
The overdue loan debt of individuals as of May 1, 2016 exceeded 1,1 trillion RUB or 10,8% of the total volume of paid funds (10,2 trillion RUB). The historical record of 10,9% on this indicator was also in March 2016.
Because of the situation created with past-due debt, the banks face a significant drop in the main result of activity - net profit indicator and increase of losses.
Thus, on January 1, 2016 the total net profit of all credit institutions in Russia decreased by 117 billion RUB or by 13,7% in relation to January 1, 2015, and the indicator of losses for the same period increased by 280 billion RUB or 106,1% - more than twice.
As seen from the graph in the Picture 1, until quite recently the banks bore symbolic losses by the overwhelming presence of net profit: on the basis of the pre-crisis 2013 the total net profit was fixed in the volume of 1,012 billion RUB, and the loss - of «only» 19 billion RUB.
By May 1, 2016 the cumulative loss of banks has eased, to 174 billion RUB, by the simultaneous fall of total profit to 341 billion RUB. Banks are on the trajectory of the zero financial result (equity of total losses and profit).
 Picture 1. Dynamics of the total net profit and loss of all credit institutions, in bln RUB
The Bank of Russia continues to carry out an active policy of withdrawal of licenses, guided by the following grounds: anti-money laundering is carried out, fight against illegal operations, doubtful statements; banks with «holes» in the capital are closed, which were caused by loan issue to structures affiliated with the management; also the banks are closed, being in poor financial standing (s. Picture 2).
101 credit organizations ceased their operations (due to the withdrawal and revocation of license) in 2015, and from January 1, 2016 up to June 22, 2016 the same fate was shared by another 51 banks.
Totally as of June 22, 2016 682 credit organizations are operating in Russia, that is almost two times less, than, for example, as of January 1, 2005 (1 299 banks).
 Picture 2. Dynamics of the number of active credit institutions and credit institutions with revoked and withdrawn license
The main reasons, why the Bank of Russia has recourse to extreme measures of influence - revocation of the license – are, primarily, a money-laundering and an illegal withdrawal of funds abroad; loss of own capital; and various types of fraud among the management of credit institutions.
| MONEY LAUNDERING | LOSS OF CAPITAL | FRAUD AMONG MANAGEMENT |
| The growth in the number of credit institutions, on which the decisions are made to revoke the license for banking operations, is mainly due to their active involvement in money-laundering and illegal withdrawal of funds abroad, that required the use of tough response actions on the part of the supervisory authority. | The growth in the number of credit institutions, on which the decisions are made to revoke the license for banking operations, is mainly due to their active involvement in money-laundering and illegal withdrawal of funds abroad, that required the use of tough response actions on the part of the supervisory authority. | The CB of the RF reveals violations in actions of the management of credit institutions on such articles of the Criminal Code of the RF as: 159 «Fraud»; 159.5 «Fraud in the sphere of insurance»; 160 «Misappropriation or Embezzlement»; 172.1 «Falsification of financial statements of account and accountability of financial institution»; 195 «Illegal actions in bankruptcy»; 196 «Deliberate bankruptcy»; 201 «Misuse of authority». |
| LICENCE REVOCATION! | ||
The rapid decline in the number of active credit institutions, as well as negative factors mentioned above, do not prohibit the growth of total banking assets, mainly due to credit institutions included in the top-10. This fact points to the concentration of the banking system, the predominance of large banks in it, as opposed to medium and small.
On January 1, 2016 the total assets of banks were at the level of 83,000 billion RUB or 102,7% to Russia's GDP for 2015 (80,804 billion RUB). The increase in assets of all credit institutions in relation to January 1, 2015 made 6,9%.
There is a customary view that the higher the bank's assets are, the more stable is the economy as a whole. In Russia, by all negative processes, for the first time it is observed the excess of assets over the size of the country's GDP. Banks, with an increase in assets, become more reliable source of liquidity for industry and public, stimulating the economic growth.
 Picture 3. Dynamics of total banking assets and their share to the GDP of the country, annual values
If we return to the issue of concentration of the banking system around the largest credit institutions, then the data in Table 1 show that the top ten banks in aggregate accumulate 65% of total assets as of January 1, 2016 this value reached 53 985 billion RUB; the increase is by 6,3% per annum. Almost one-third (28,4%) of country's banking assets accounts for the Sberbank.
Table 1. The largest Russian banks on total assets
| Name of the credit institution | Assets as of 1.01.2016, in bln RUB | Increase (decrease) of assets by 1.01.2015, % | Share in total assets as of 1.01.2016, % | |
|---|---|---|---|---|
| 1 | Sberbank | 23 546 | 5,4 | 28,4 |
| 2 | VTB | 9 414 | 12,6 | 11,3 |
| 3 | Gazprombank | 5 178 | 9,6 | 6,2 |
| 4 | FC Otkritie | 3 029 | 10,7 | 3,6 |
| 5 | VTB 24 | 3 001 | 4,2 | 3,6 |
| 6 | Russian Agricultural Bank | 2 652 | 22,5 | 3,2 |
| 7 | Alfa-bank | 2 286 | -1,2 | 2,8 |
| 8 | BM-Bank (former - Bank of Moscow) | 1 842 | -23,9 | 2,2 |
| 9 | National Clearing Centre | 1 609 | 8,0 | 1,9 |
| 10 | UniCredit Bank | 1 428 | 3,2 | 1,7 |
| Amount of assets on the top-10 | 53 985 | 6,3 | 65,0 | |
| Amount of assets of all banks | 83 000 | 6,9 | 100 |
As of January 1, 2016, Sberbank is the largest bank also on the indicator of the net profit of 236 billion RUB, however the final financial results of the leading credit organization on Russia fell by 22,7% by January 1, 2015, when the net profit made 306 billion RUB.
Taken as a whole Sberbank generates 32,1% of the net profit of all banks (with the exception of unprofitable banks), that confirms once again the idea of continuing monopolization of the banking services market.
Table 2. The most profitable banks of Russia
| Name of the credit institution | Net profit as of 1.01.2016, in bln RUB | Increase (decrease) of net profit by 1.01.2015, % | Share in total profit as of 1.01.2016, % | |
|---|---|---|---|---|
| 1 | Sberbank | 236 | -22,7 | 32,1 |
| 2 | Alfa-bank | 50 | 1,6 | 6,7 |
| 3 | VTB | 49 | 142,8 | 6,6 |
| 4 | National Clearing Centre | 23 | 101,3 | 3,1 |
| 5 | Raiffeisenbank | 20 | -18,8 | 2,7 |
| 6 | Russian Standard | 17 | 1 053,4 | 2,2 |
| 7 | Citibank | 15 | 97,4 | 2,0 |
| 8 | Moscow Regional Bank | 11 | there was loss | 1,5 |
| 9 | Sovcombank | 11 | 63,8 | 1,5 |
| 10 | Promsvyazbank | 11 | 6 583,0 | 1,5 |
| Amount of net profit on the top-10 | 442 | - | 60,1 | |
| Profit of all banks | 736 | -13,7 | 100,0 |
Thus, in spite of the down trend on past-due accounts (decrease in the share of overdue debts in total arrears to banks), risks of the stability of the whole banking system remain. If the country will face a new wave of negative external and internal factors, such as the resumption of decline on commodity markets, escalation in Ukraine, tightening of sanctions, disrupting inflation, key rate increase etc., then a visible positive vector may change.
Net profit ratio of the largest Russian livestock farms
Information Agency Credinform has prepared the ranking of the largest Russian livestock farms.
The largest enterprises (TOP-10) in terms of revenue were selected according to the data from the Statistical Register for the latest available period (for the year 2014). Then, the companies were ranged by decrease in net profit ratio (Table 1).
Net profit ratio (%) is calculated as a ratio of net profit (loss) to sales revenue. The ratio reflects the company’s level ofsales profit.
The ratio doesn’t have the standard value. It is recommended to compare the companies within the industry or the change of a ratio in time for a certain company. The negative value of the ratio indicates about net loss. The higher is the ratio value, the better the company operates.
For the most full and fair opinion about the company’s financial position, not only financial ratios should be taken into account, but also the whole set of financial indicators and ratios.
| Name, INN, Region | 2014 netprofit, mln RUB | 2014 revenue, mln RUB | 2014/2013 revenue, % | Net profit ratio, % | Solvency index Globas-i |
|---|---|---|---|---|---|
| LLC SVINOKOMPLEX SAFONOVSKIY INN 3109004344 Belgorod region |
2 054,7 | 4 225,6 | 143 | 48,63 | 600 Unsatisfactory |
| LLC TAMBOV BACON INN 6803629911 Tambov region |
4 702,8 | 9 829,3 | 387 | 47,84 | 260 High |
| LLC CHERKIZOVO-SVINOVODSTVO INN 4812042756 Lipetsk region |
2 038,1 | 5 062,2 | 157 | 40,26 | 241 High |
| NAO SVINOKOMPLEX URALSKIY INN 6658238860 Sverdlovsk region |
1 626,0 | 4 279,5 | 162 | 38,00 | 241 High |
| LLC SVINOKOMPLEX KALINOVSKIY INN 3115006318 Belgorod region |
2 097,6 | 5 665,7 | 126 | 37,02 | 208 High |
| LLC KAMSKIY BACON INN 1650128842 Republic of Tatarstan |
1 568,5 | 5 254,2 | 172 | 29,85 | 220 High |
| ZAO TROPAREVO INN 5028001885 Moscow region |
1 175,9 | 4 325,7 | 155 | 27,18 | 157 The highest |
| JSC SIBERIAN AGRARIAN GROUP INN 7017012254 Tomsk region |
732,2 | 5 587,4 | 135 | 13,10 | 214 High |
| GESCHLOSSENE AKTIENGESELLSCHAFT ALEKSEEVSKY BACON INN 3122506583 Belgorod region |
593,0 | 5 634,4 | 184 | 10,52 | 236 High |
| NAO SVINOKOMPLEX KOROCHA INN 3110009570 Belgorod region |
0,8 | 41 521,0 | 149 | 0,0019 | 248 High |
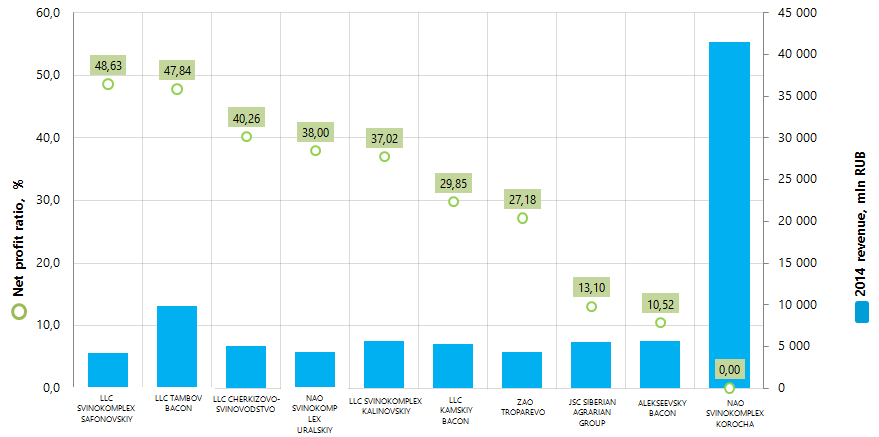
The leader of the ranking by 2014 revenue NAO SVINOKOMPLEX KOROCHA takes the last place of the list. Despite the fact, that the company’s share in total revenue of TOP-10 amounted to 45%, its net profit decreased by almost a thousand times in comparison with the previous period and amounted to 844 th RUB. In this regard the net profit ratio value amounted to 0,0019%, i.e. almost near zero values.
The highest net profit ratio has LLC SVINOKOMPLEX SAFONOVSKIY (48,63%). However, the company has unsatisfactory solvency index Globas-i due to the upcoming liquidation in connection with its merger with another legal entity within the structural changes in Agro-industrial holding Miratorg, the owner of the company.
Other 9 participants of the ranking have the highest and high solvency index Globas-i, that shows the ability of enterprises to meet their obligations in time and fully.
Picture 1. Net profit ratio and revenue of the largest Russian livestock farms (TOP-10)

According to 2014 results, the total revenue of TOP-10 enterprises amounted to 91,4 bln RUB, that is 77% more than in 2013. Meanwhile the revenue growth of TOP-100 companies during the same period amounted to 46%, this may indicate about the trend of concentration of production in large enterprises within the industry. This is also testified by a comparison of average values of net profit ratio within group of companies: 29,24% (TOP-10) against 17,44% (TOP-100).
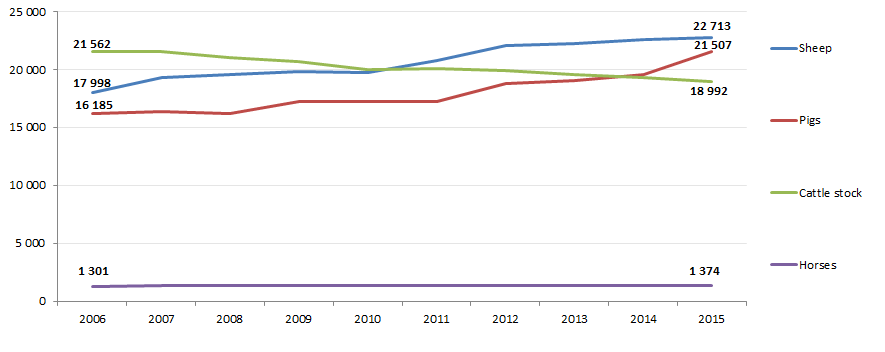
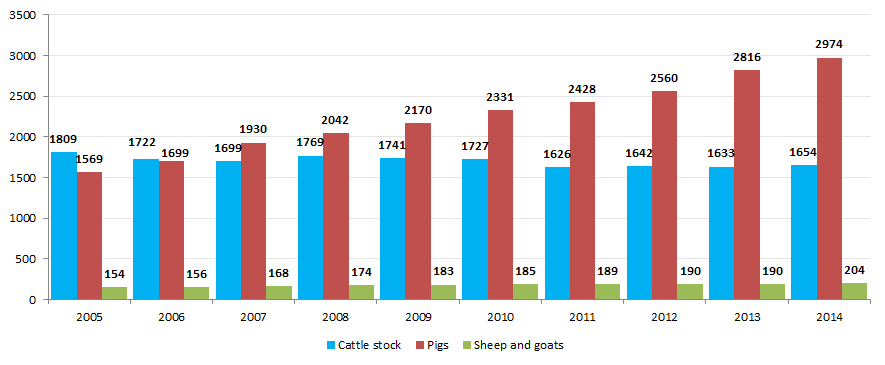
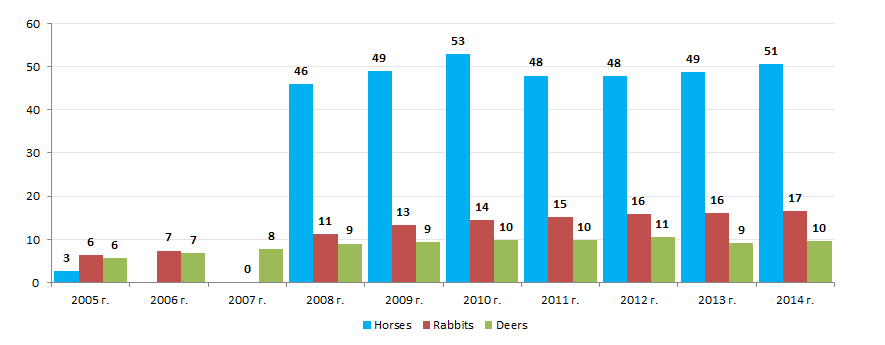
The industry as a whole demonstrates impressive 2014 results against the background of the economic situation in the country. This testifies the data from the Federal State Statistics Service (Pictures 2, 3 and 4).

The growth of livestock population within 10 years amounted to 33% (pigs), 26% (sheep), 6% (horses). The population of cattle stock decreased by 12%.
Picture 3. The growth of main types of farm animals for slaughter in slaughter weight within farms of all categories (per year, th tons)

Similar results can be seen among the indicators of livestock production in slaughter weight; within 10 years the growth in pig breeding amounted to 1,9 times, sheep and goat breeding - 1,3 times, dear breeding - 1,7 times, rabbit breeding - 2,6 times, horse breeding - 18,7 times. The indicator decreased by 9% only in cattle breeding.
Picture 4. The growth of other farm animals for slaughter in slaughter weight within farms of all categories (per year, th tons)

Livestock breeding is characterized by relatively equal concentration of enterprises across the country; this fact is confirmed by the data from the Information and analytical system Globas-i on distribution across the country of 100 largest registered companies of the industry in terms of 2014 revenue (TOP-11 of regions).
| Region | Number of enterprises |
|---|---|
| Belgorod region | 16 |
| Leningrad region | 9 |
| Moscow region | 6 |
| Krasnodar region | 5 |
| Oryol region | 5 |
| Tyumen region | 5 |
| Sverdlovsk region | 4 |
| Altai region | 3 |
| Kaliningrad region | 3 |
| Kemerovo region | 3 |
| Kursk region | 3 |