
Order a report
Custom-made industry research, company ratings, competitor analysis


Trends in the field of extraction and primary stone processing
Information Agency Credinform has prepared the review of trends in the field of extraction and primary stone processing.
The largest enterprises (TOP-10 and TOP-1000) in terms of annual revenue were selected according to the data from the Statistical Register for the latest available periods (2015 and 2016). The analysis was based on data of the Information and Analytical system Globas.
Legal forms
The most popular legal form among companies in the field of extraction and primary stone processing is Limited Liability Company. A significant place also take public and non-public joint stock companies (Picture 1).
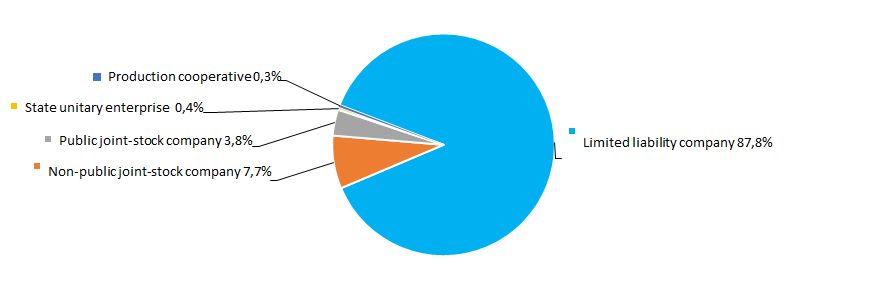 Picture 1. Distribution of TOP-1000 companies by legal forms
Sales revenue
In 2016 total revenue of 10 largest companies amounted to 25% from TOP-1000 total revenue. This fact testifies rather high level of competition within the industry. In 2016, the largest company by total revenue is LLC KNAUF GIPS BAIKAL(Picture 2).
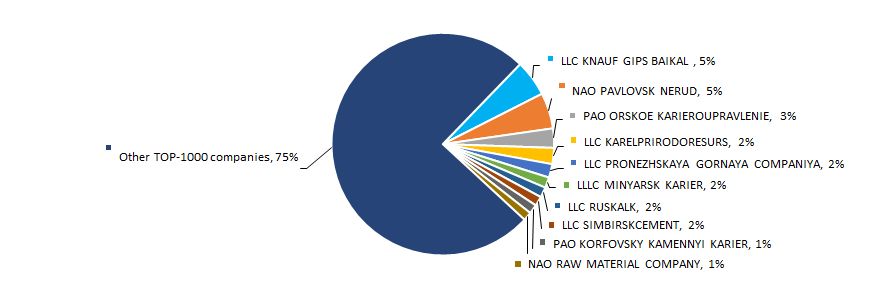 Picture 2. The shares of TOP-10 companies in TOP-1000 total revenue for 2016, %
The best results by revenue among the industry for the ten-year period were achieved in 2008. The decrease in average industry indicators was observed within crisis phenomena in the economy in 2009 -2010 and 2012-2014 (Picture 3).
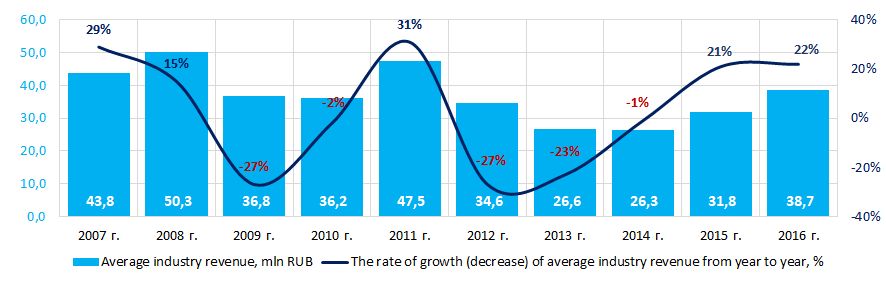 Picture 3. The change of average industry revenue of the companies in the field of extraction and primary stone processing in 2007-2016
Profit and loss
In 2016 profit of 10 largest companies amounted to 50% from TOP-1000 total profit. In 2016, the leading position by amount of profit takes NAO PAVLOVSK NERUD (Picture 4).
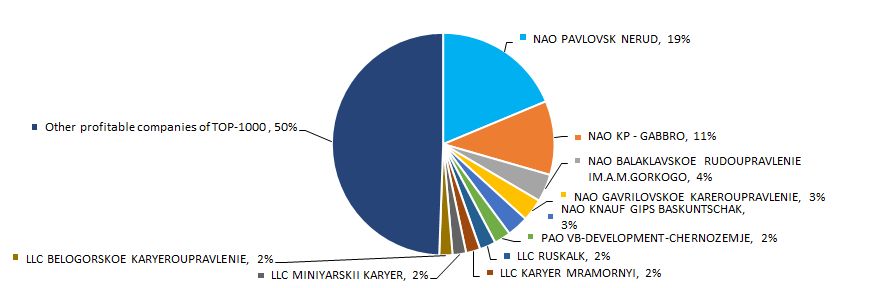 Picture 4. The shares of TOP-10 companies in TOP-1000 total profit for 2016, %
For the ten-year period, the industry revenue values of companies in the field of extraction and primary stone processing are not stable. The decrease in indicators was observed in 2008 - 2009, 2013 - 2014 against the background of crisis phenomena in the economy. Thus, in 2009, 2010 and 2014 the average industry revenue was negative. The best results of the industry were in 2007 (Picture 5).
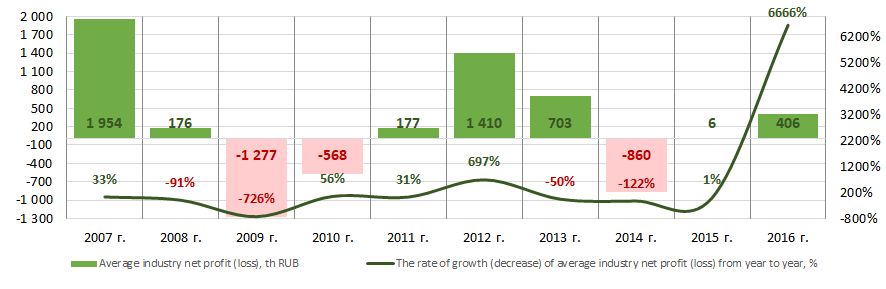 Picture 5. The change of average industry profit of the companies in the field of extraction and primary stone processing in 2007-2016
In 2015, the TOP-1000 list included 360 loss-making companies. In 2016 the number of loss-making companies decreased to 346 or by 4%. Meanwhile, their average loss decreased by 12%. The average profit of other companies from TOP-1000 list increased by 18% for the same period (Picture 6).
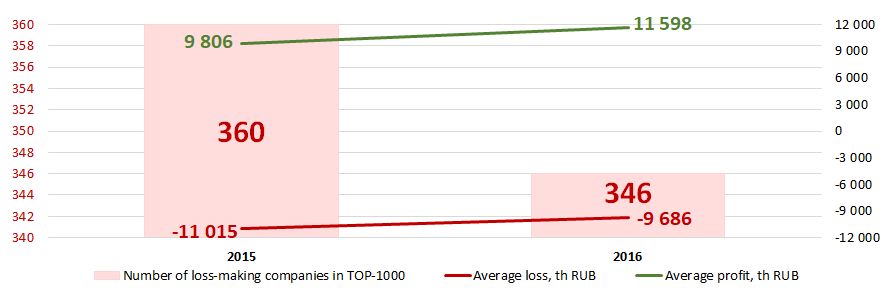 Picture 6. The number of loss-making companies, average loss and profit within TOP-1000 companies in 2015 – 2016
Main financial indicators
For the ten-year period, the average industry values of current liquidity ratio within 8 years were lower than recommended values - from 1,0 to 2,0. (yellow color on Picture 7).
Current liquidity ratio (ratio of total working capital to short-term liabilities) shows the sufficiency of company’s assets to meet short-term obligations.
Solvency ratio (ratio of equity capital to total balance) shows the company’s dependence from external borrowings. The recommended value of the ratio is >0,5. The ratio value less than minimum limit signifies about strong dependence from external sources of funds.
The calculation of practical values of financial indicators, which might be considered as normal for a certain industry, has been developed and implemented in the Information and Analytical system Globas by the experts of Information Agency Credinform, taking into account the actual situation of the economy as a whole and the industries. In 2016 the practical value of solvency ratio for companies engaged in extraction and primary stone processing is from -0,04 to 0,87.
For the ten-year period, the average industry values of the ratio were lower than recommended values and within practical values (Picture 7).
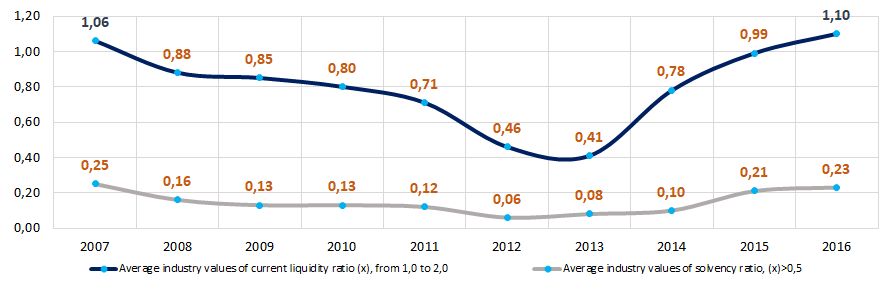 Picture 7. Changes of average industry values of current liquidity ratio and solvency ratio of companies engaged in extraction and primary stone processing in 2007 – 2016
 For the last ten years, the instability of ROI ratio was observed. In the periods of crisis phenomena in the economy (2009, 2010, 2014, 2015) the ratios decreased to negative values (Picture 8). The ROI ratio is calculated as a ratio of net profit to sum of stockholder equity and long-term liabilities and shows the return from equity involved in commercial activities and long-term borrowed funds.
Within the same period, the products profitability ratio was rather stable (Picture 8). The greatest growth of indicators was observed in 2007, 2012 - 2013. Product profitability ratio is a ratio of sales profit to general expenses. In general, the profitability characterizes the production efficiency.
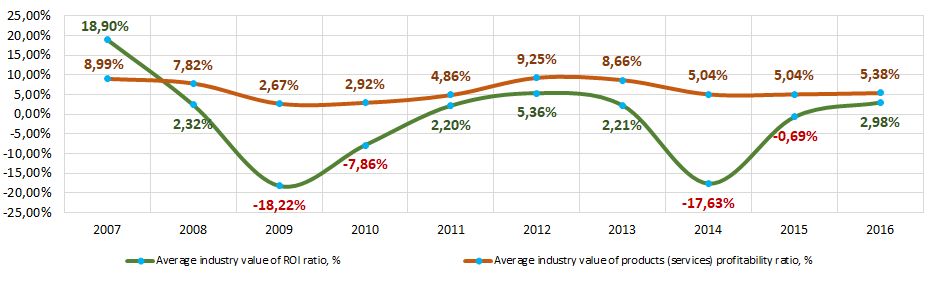 Picture 8. Changes of average industry values of ROI ratio and products (services) profitability ratio of companies engaged in extraction and primary stone processing in 2007 – 2016
 For the ten-year period, the values of assets turnover ratio were rather stable with smooth decrease and growth periods (Picture 9).
Assets turnover ratio is the ratio of sales revenue and company’s average total assets for a period. It characterizes the effectiveness of using of all available resources, regardless the source of their attraction. The ratio shows how many times per year the full cycle of production and circulation is performed, generating the corresponding effect in the form of profit.
Equity turnover ratio is calculated as a ratio of revenue to yearly average sum of equity and demonstrates the company’s usage rate of total assets.
Within 2013 – 2016, the significant decrease in ratio values was observed (Picture 9).
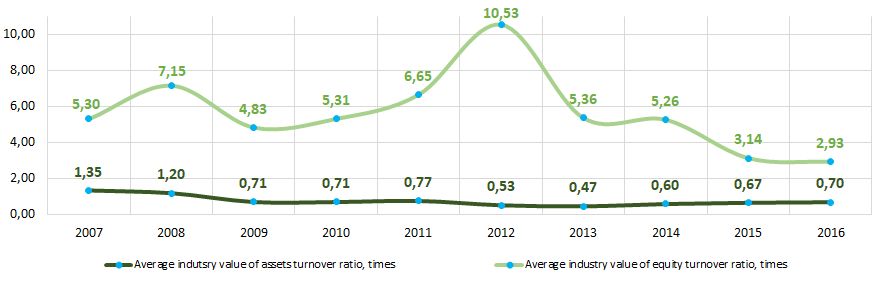 Picture 9. Changes of average industry values of activity ratios of companies engaged in extraction and primary stone processing in 2007 – 2016
 Production structure
More than a half of TOP-1000 companies are engaged in extraction of ornamental and building stone, limestone, gypsum, chalk and shale (Picture 10).
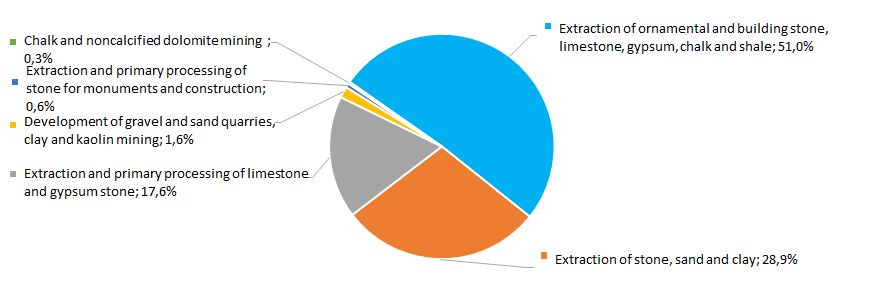 Picture 10. Distribution of TOP-1000 companies by products type, %
Dynamics of business activity
Over a 25-year period, the registered companies from TOP-1000 list are unequally distributed by the year of foundation.
Most of the companies engaged in extraction and primary stone processing were founded in 2008 (Picture 11).
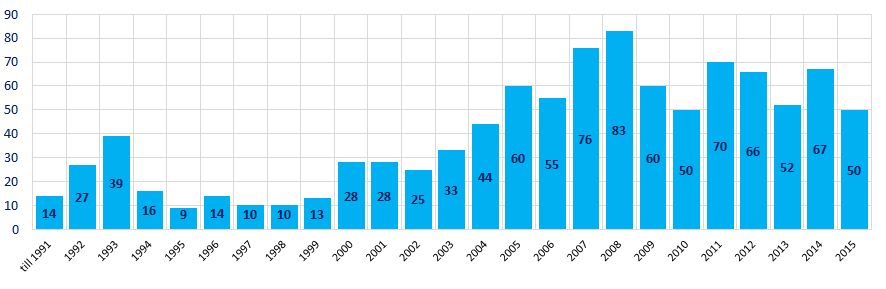 Picture 11. Distribution of TOP-1000 companies by the year of foundation
The most outstanding interest of business to extraction and primary stone processing was shown in 2005 – 2009, the average number of registered companies was 67 newly established companies (Picture 12).
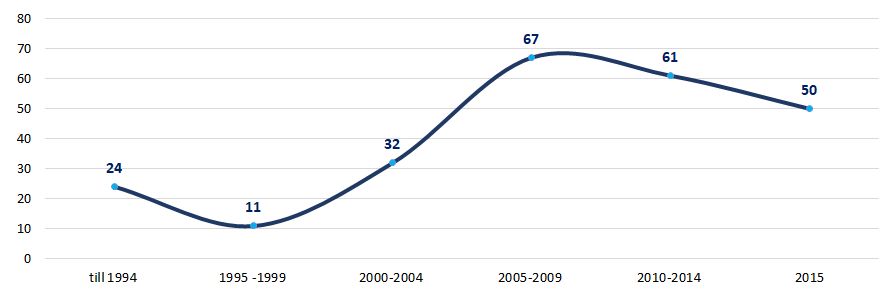 Picture 12. Average number of TOP-1000 companies, registered within a year, by year of foundation
 Main regions of activity
Companies engaged in extraction and primary stone processing are unequally distributed across the country. Most of them are registered in Chelyabinsk region and the Republic of Karelia in locations of the largest deposits of relevant natural resources (Picture 13). TOP-1000 companies are registered in 79 regions of the Russian Federation.
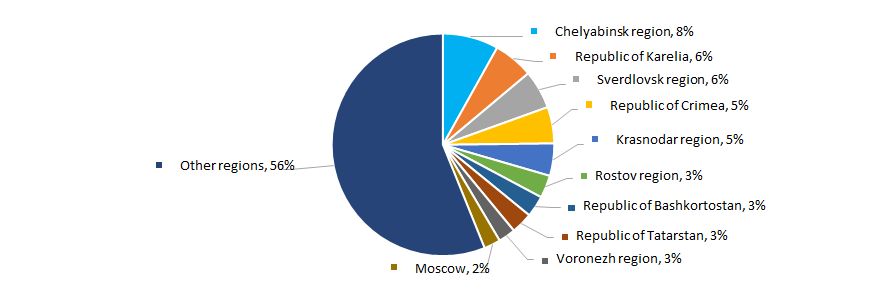 Picture 13. Distribution of TOP-1000 companies by Russian regions
Most of the companies engaged in extraction and primary stone processing are concentrated in Central Federal District (Picture 14).
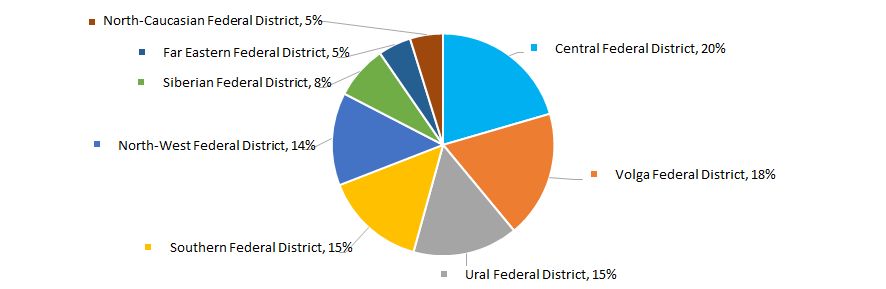 Picture 14. Distribution of TOP-1000 companies by federal districts of Russia
The share of companies from TOP-1000 list with branches or representative offices amounted to 2,5%.
Participation in arbitration proceedings
More than a quarter of industry companies don’t participate in arbitration proceedings. Most of the companies participate in arbitration proceedings inactively (Picture 15).
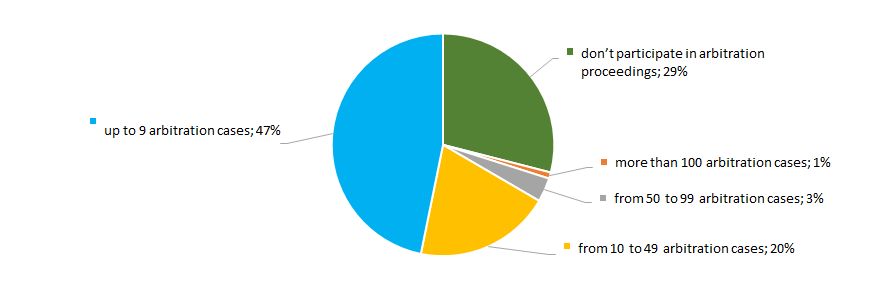 Picture 15. Distribution of TOP-1000 companies by participation in arbitration proceedings, %
Reliability index
From the point of flight-by-night features or unreliable companies, the vast majority of industry companies show rather low level of cooperation (Picture 16).
 Picture 16. Distribution of TOP-1000 companies by reliability index, %
Financial position score
The assessment of company’s financial position shows that the greatest number of companies are in average financial position. However, more than one third of TOP-1000 companies are in unstable financial position (Picture 17).
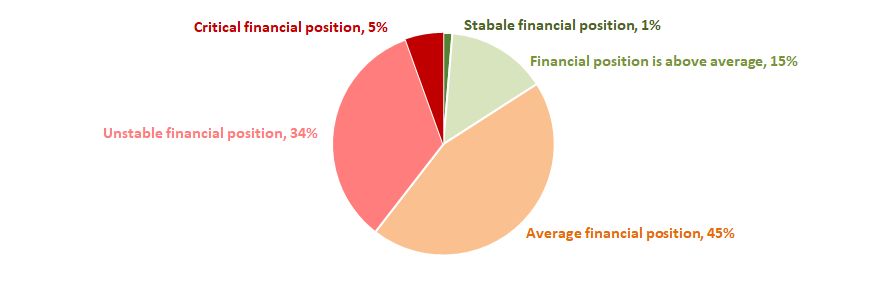 Picture 17. Distribution of TOP-1000 companies by financial position score, %
Liquidity index
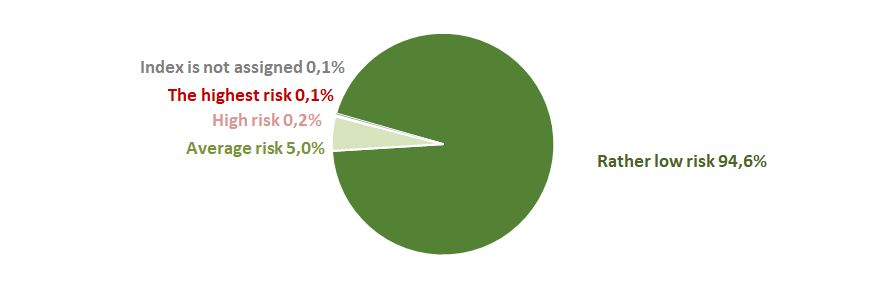
Significant part of industry companies (30%) have minimal or insignificant level of bankruptcy risk in the short-term period. However, the share of companies with risk level above average and the highest level amounted to 39% (Picture 18).
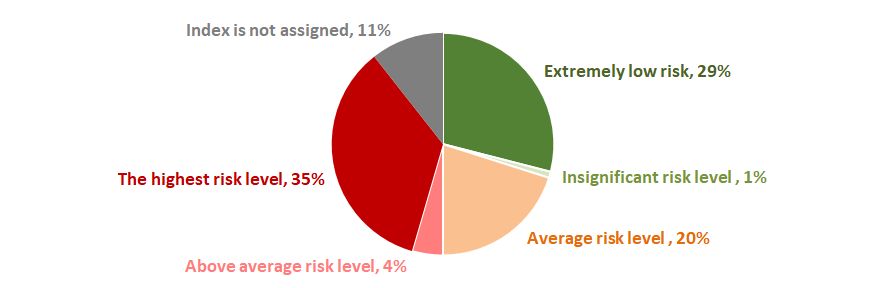 Picture 18. Distribution of TOP-1000 companies by liquidity index, %
Solvency index Globas
More than a half of TOP-1000 companies engaged in extraction and primary stone processing have adequate solvency index Globas (Picture 19).
In general, taking into account the main indexes, financial indicators and ratios, this may indicate about unfavorable trends in this field of activity.
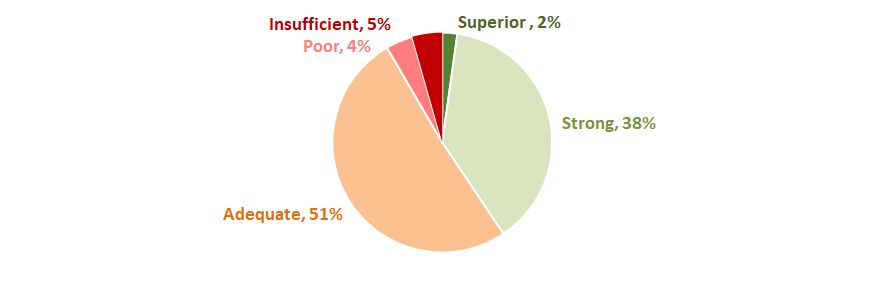 Picture 19. Distribution of TOP-1000 companies by solvency index Globas