Trends in activity of security companies
Information agency Credinform has prepared a review of activity trends of the largest Russian security companies.
The largest companies (ТОP-1000) in terms of annual revenue were selected according to the data from the Statistical Register for the latest available periods (2013 - 2018). The analysis was based on data of the Information and Analytical system Globas.
Net assets is a ratio reflecting the real value of company's property. It is calculated annually as the difference between assets on the enterprise balance and its debt obligations. The ratio is considered negative (insufficiency of property), if company’s debt exceeds the value of its property.
The largest company in terms of net assets is SECURITY COMPANY AMULET LLC, INN 5609068043, Orenburg region. In 2018 net assets of the company amounted to 284 million RUB.
The smallest size of net assets in TOP-1000 had PRIVATE SECURITY ENTERPRISE AERO GUARD LLC, INN 5009045622, Moscow region. The lack of property of the company in 2018 was expressed in negative terms -150 million RUB.
For the last ten years, the average values of TOP-1000 net assets showed the growing tendency with positive dynamics of growth rates (Picture 1).
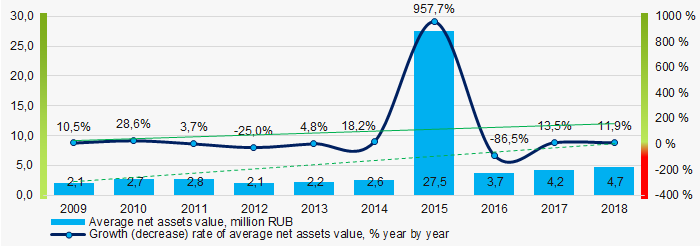 Picture 1. Change in average net assets value of ТОP-1000 companies in 2009 – 2018
For the last five years, the share of ТОP-1000 enterprises with lack of property is decreasing (Picture 2).
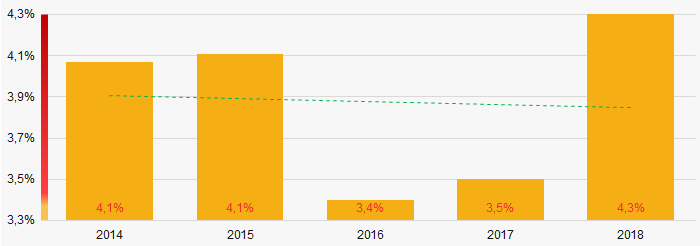 Picture 2. The share of enterprises with negative net assets value in ТОP-1000
Sales revenue
In 2018, the total revenue of 10 largest companies amounted to 13% from ТОP-1000 total revenue (Picture 3). This fact testifies the high level of competition in the industry.
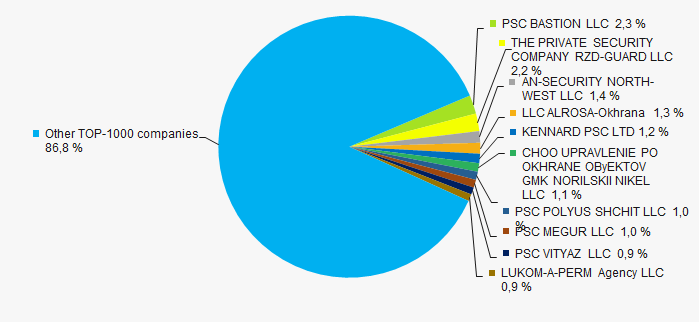 Picture 3. Shares of TOP-10 in TOP-1000 total revenue for 2018
In general, the growing trend in sales revenue with positive dynamics of growth rates is observed (Picture 4).
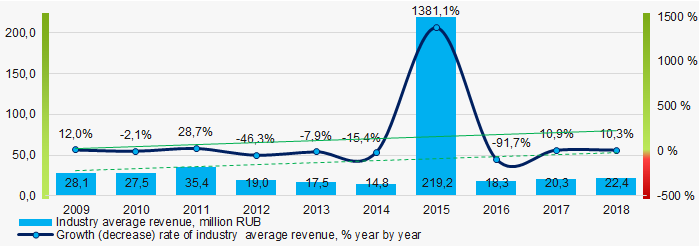 Picture 4. Change in average revenue of TOP-1000 in 2009 – 2018
Profit and loss
The largest company in terms of net profit is PSC BASTION LLC, INN 8904047159, Yamalo-Nenets Autonomous Okrug. In 2019 the company’s profit amounted to 271 million RUB.
For the last ten years, the average profit values of TOP-1000 show the growing tendency with a decrease in growth rates (Picture 5).
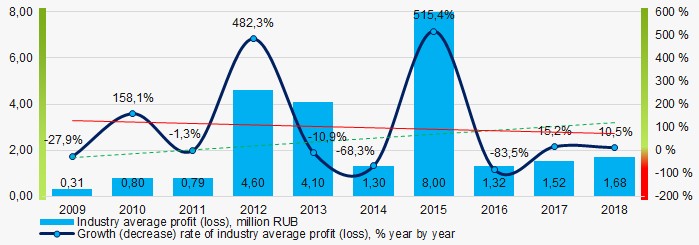 Picture 5. Change in average profit (loss) in 2009 – 2018
Over a five-year period, the average net profit values of ТОP-1000 show the growing tendency, along with this the average net loss is also increasing (Picture 6).
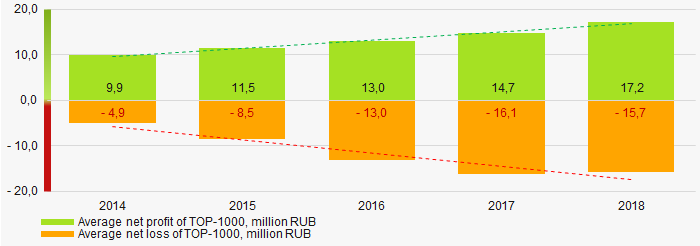 Picture 6. Change in average net profit/loss of ТОP-1000 companies in 2014 – 2018
 Main financial ratios
For the last ten years, the average values of the current liquidity ratio were within the recommended values - from 1,0 to 2,0, with growing trend (Picture 7).
The current liquidity ratio (ratio of total working capital to short-term liabilities) shows the sufficiency of company’s assets to meet short-term obligations.
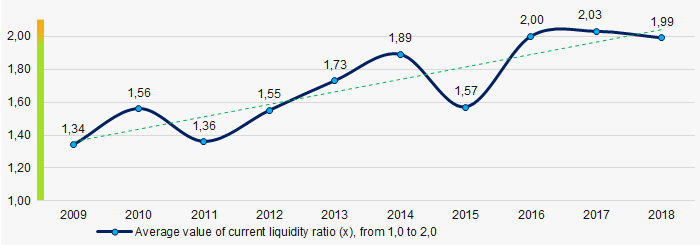 Picture 7. Change in average values of current liquidity ratio in 2009 – 2018
Within ten years, the downward trend of the average values of ROI ratio is observed (Picture 8).
The ROI ratio is calculated as a ratio of net profit to sum of stockholder equity and long-term liabilities and shows the return from equity involved in commercial activities and long-term borrowed funds.
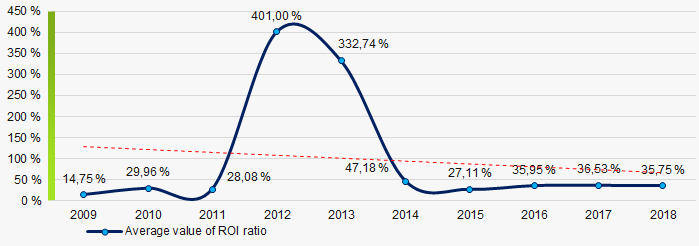 Picture 8. Change in average values of ROI ratio in 2009 – 2018
Assets turnover ratio is the ratio of sales revenue and company’s average total assets for a period. It characterizes the effectiveness of using of all available resources, regardless the source of their attraction. The ratio shows how many times per year the full cycle of production and circulation is performed, generating the corresponding effect in the form of profit.
For the last ten years, this business activity ratio demonstrated the downward trend (Picture 9).
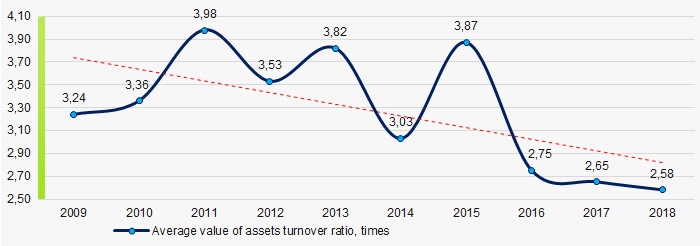 Picture 9. Change in average values of assets turnover ratio in 2009 – 2018
Small businesses
91% of ТОP-1000 companies are registered in the Unified register of small and medium-sized enterprises of the Russian Federal Tax Service. Herein, their share in TOP-1000 total revenue is almost 65%, which is more than three times higher than the national average value in 2018 – 2019 (Picture 10).
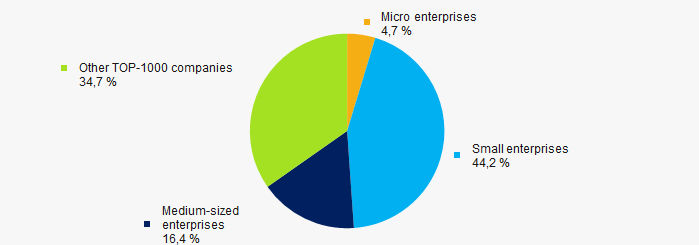 Picture 10. Shares of small and medium-sized enterprises in ТОP-1000
Main regions of activity
ТОP-1000 companies are unequally located across the country and registered in 73 regions of Russia. More than 48% of the largest enterprises in terms of revenue are located in Moscow, Moscow region and St. Petersburg (Picture 11).
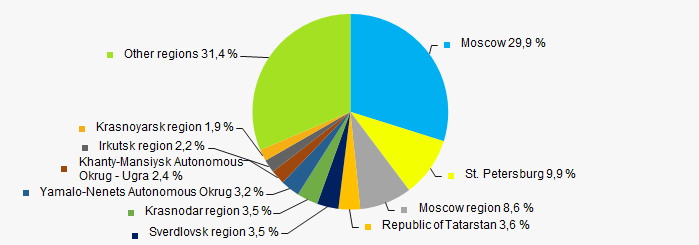 Picture 11. Distribution of TOP-1000 revenue by the regions of Russia
Financial position score
An assessment of the financial position of TOP-1000 companies shows that the largest part have above average financial position (Picture 12).
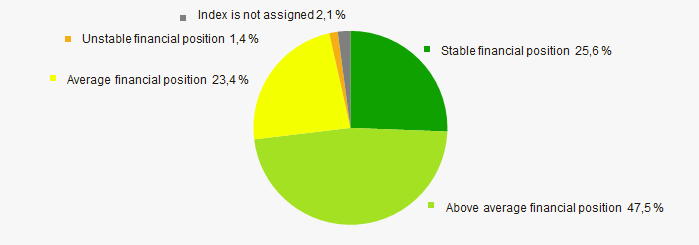 Picture 12. Distribution of TOP-1000 companies by financial position score
Solvency index Globas
Most of TOP-1000 companies got superior/high or strong/medium Solvency index Globas, this fact shows the ability of the companies to meet their obligations in time and fully (Picture 13).
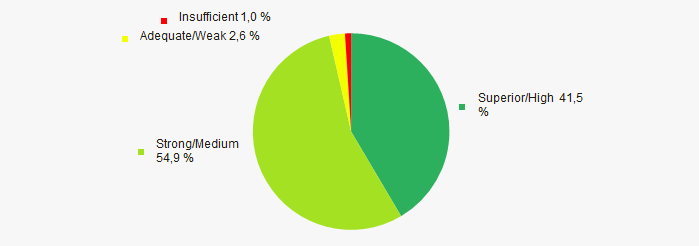 Picture 13. Distribution of TOP-1000 companies by Solvency index Globas
Conclusion
A complex assessment of activity of the largest Russian security companies, taking into account the main indexes, financial ratios and indicators, demonstrates the presence of positive trends (Table 1).
| Trends and assessment factors | Relative share, % |
| Dynamics of average net assets value |  10 10 |
| Growth/drawdown rate of average net assets value |  10 10 |
| Increase / decrease in the share of enterprises with negative net assets |  10 10 |
| The level of competition / monopolization |  10 10 |
| Dynamics of average net profit |  10 10 |
| Growth/drawdown rate of average revenue |  10 10 |
| Dynamics of average revenue |  10 10 |
| Growth/drawdown rate of average net profit (loss) |  -10 -10 |
| Increase / decrease in average net profit of companies |  10 10 |
| Increase / decrease in average net loss of companies |  -10 -10 |
| Increase / decrease in average values of current liquidity ratio |  10 10 |
| Increase / decrease in average values of ROI ratio |  -10 -10 |
| Increase / decrease in average values of assets turnover ratio, times |  -10 -10 |
| Share of small and medium-sized businesses by revenue more than 20% |  10 10 |
| Regional concentration |  -10 -10 |
| Financial position (the largest share) |  10 10 |
| Solvency index Globas (the largest share) |  10 10 |
| Average value of factors |  4,1 4,1 |
 favorable trend (factor) ,
  unfavorable trend (factor).
Return on assets of security companies
Information agency Credinform has prepared a ranking of the largest Russian security companies. The largest enterprises (TOP-10) in terms of annual revenue were selected according to the data from the Statistical Register for the available periods (2016-2018). Then the companies were ranged by return on assets ratio (Table 1). The analysis was based on the data from the Information and Analytical system Globas.
Return on assets (%) is calculated as the relation of the sum of net profit and interest payable to the total assets value of a company and shows how many monetary units of net profit are earned by every unit of total assets.
The ratio characterizes the effectiveness of using by the company of its resources. The higher is the ratio value, the more effective is business, that is the higher the return per every monetary unit invested in assets.
However, it is necessary to take into account that the book value of assets may not correspond to their current market value. For example, under the influence of inflation, the book value of fixed assets will increasingly be underestimated in time, that will lead to an overestimation of the return on assets. Thus, it is necessary to take into account not only the structure, but also the age of the assets.
It should be also taken into account the dynamics of this indicator. Its consistent decline indicates a drop in asset utilization.
For the most full and fair opinion about the company’s financial position the whole set of financial indicators and ratios should be taken into account.
| Name, INN, region | Revenue, million RUB | Net profit (loss), million RUB | Return on assets,% | Solvency index Globas | |||
| 2017 | 2018 | 2017 | 2018 | 2017 | 2018 | ||
| 1 | 2 | 3 | 4 | 5 | 6 | 7 | 8 |
| PSC BASTION LLC ИНН 8904047159 Yamalo-Nenets Autonomous Okrug |
 1 806,2 1 806,2 |
 2 291,0 2 291,0 |
 288,9 288,9 |
 360,5 360,5 |
 65,35 65,35 |
 86,14 86,14 |
136 Superior |
| CHOO UPRAVLENIE PO OKHRANE OByEKTOV GMK NORILSKII NIKEL LLC ИНН 7705393628 Moscow |
 1 042,3 1 042,3 |
 1 049,5 1 049,5 |
 60,7 60,7 |
 26,0 26,0 |
 41,97 41,97 |
 21,72 21,72 |
191 High |
| LUKOM-A-PERM Agency LLC ИНН 5902189473 Perm Territory |
 745,9 745,9 |
 848,1 848,1 |
 37,6 37,6 |
 25,3 25,3 |
 16,43 16,43 |
 12,95 12,95 |
200 Strong |
| THE PRIVATE SECURITY COMPANY RZD-GUARD LLC ИНН 7701859844 Moscow |
 2 169,7 2 169,7 |
 2 150,0 2 150,0 |
 34,3 34,3 |
 68,5 68,5 |
 6,37 6,37 |
 12,50 12,50 |
202 Strong |
| AN-SECURITY NORTH-WEST LLC ИНН 7806302994 St. Petersburg |
 812,7 812,7 |
 1 414,2 1 414,2 |
 8,5 8,5 |
 48,3 48,3 |
 4,18 4,18 |
 12,19 12,19 |
180 High |
| KENNARD PSC LTD ИНН 1655030632 Republic of Tatarstan |
 728,9 728,9 |
 1 147,2 1 147,2 |
 40,8 40,8 |
 49,1 49,1 |
 21,16 21,16 |
 6,18 6,18 |
181 High |
| PSC VITYAZ LLC ИНН 1649005010 Republic of Tatarstan |
 840,3 840,3 |
 873,6 873,6 |
 5,2 5,2 |
 5,2 5,2 |
 2,67 2,67 |
 2,67 2,67 |
191 High |
| PSC MEGUR LLC ИНН 7724287600 Moscow |
 973,0 973,0 |
 969,4 969,4 |
 0,7 0,7 |
 0,7 0,7 |
 0,10 0,10 |
 0,59 0,59 |
237 Strong |
| PSC POLYUS SHCHIT LLC ИНН 2463069959 Krasnoyarsk region |
 1 806,2 1 806,2 |
 2 291,0 2 291,0 |
 -40,8 -40,8 |
 -6,0 -6,0 |
 -21,89 -21,89 |
 -2,69 -2,69 |
257 Medium |
| LLC ALROSA-Okhrana ИНН 1433018056 The Republic of Sakha (Yakutia) |
 1 285,5 1 285,5 |
 1 327,8 1 327,8 |
 3,9 3,9 |
 -12,2 -12,2 |
 1,51 1,51 |
 -4,08 -4,08 |
220 Strong |
| Average value for TOP-10 companies |  1 131,0 1 131,0 |
 1 307,0 1 307,0 |
 44,0 44,0 |
 56,8 56,8 |
 13,79 13,79 |
 14,82 14,82 |
|
| Average industry value |  20,4 20,4 |
 22,4 22,4 |
 1,5 1,5 |
 1,7 1,7 |
 17,48 17,48 |
 17,09 17,09 |
|
 growth of indicator in comparison with prior period,
  decline of indicator in comparison with prior period
The average value of return on assets for TOP-10 companies is lower than average industry value: in 2018, six companies improved the results.
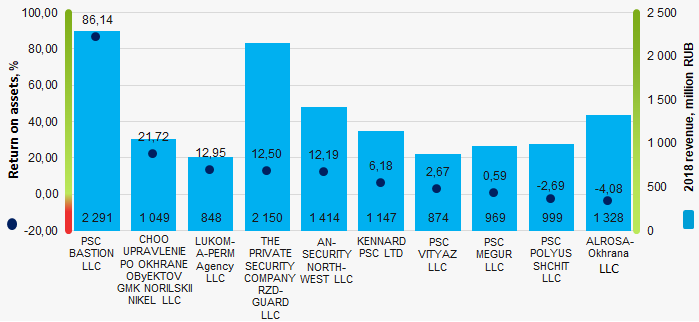 Picture 1. Return on assets and revenue of the largest Russian security companies (ТОP-10)
Within 10 years, the average industry indicators of return on assets ratio showed the growing tendency. (Picture 2).
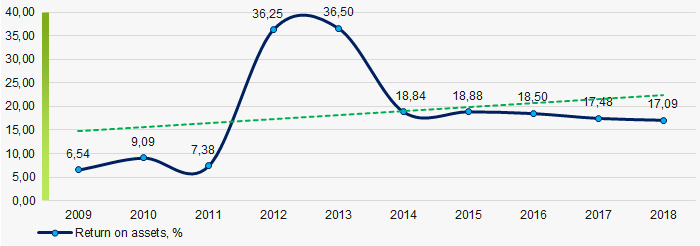 Picture 2. Change in average industry values of return on assets of Russian security companies in 2009 – 2018