
Order a report
Custom-made industry research, company ratings, competitor analysis


Current liquidity ratio of the largest Russian advertising agencies
Information Agency Credinform Credinform has prepared the ranking of the largest Russian advertising agencies. The largest enterprises (TOP-10 and TOP-500) in terms of annual revenue were selected according to the data from the Statistical Register for the latest available periods (2015 and 2014). Then the companies were ranged by 2015 current liquidity ratio (Table 1).
Current liquidity ratio (х) is a ratio of total working capital to short-term liabilities. The ratio shows the sufficiency of company’s assets to meet short-term obligations.
The recommended value is from 1,0 to 2,0. The ratio value less than 1 indicates about the excess of short-term liabilities over current working capital.
The calculation of practical values of financial indicators, which might be considered as normal for a certain industry, has been developed and implemented in the Information and Analytical system Globas®, by the experts of Information Agency Credinform Credinform taking into account the actual situation of the economy as a whole and the industries. The practical value of current liquidity ratio for advertising agencies is from 1,00 to 3,19.
For the most full and fair opinion about company’s financial position the whole set of financial indicators and ratios should be taken into account.
| Name, INN, region, date of foundation | 2015 net profit | 2015 revenue, | 2015/2014 revenue, % | Current liquidity | Solvency index Globas® |
| LLC GALLERY SERVICE INN 7714564333 Moscow 10.08.2004 | -726,6 | 4 287,7 | -20,9 | 7,75 | 302 Satisfactory |
| LLC GAZPROM-MEDIA INN 7728665444 Moscow 17.07.2008 | 1 371,4 | 3 671,8 | -15,9 | 2,92 | 231 High |
| LLC RUSS OUTDOOR INN 7731196087 Moscow region 03.11.1995 | -744,4 | 5 436,8 | -4,9 | 2,03 | 297 High |
| LLC POSTERSCOPE INN 7701573387 Moscow 20.12.2004 | 144,4 | 3 531,1 | 21,8 | 1,77 | 254 High |
| LLC Dentsu Aegis CS INN 7709583813 Moscow 17.12.2004 | 400,3 | 15 818,7 | -15,5 | 1,58 | 290 High |
| LLC KEH ECOMMERCE INN 7710668349 Moscow 27.03.2007 | 3 116,3 | 6 662,4 | 55,6 | 1,34 | 204 High |
| LLC PUBLICIS GROUPE MEDIA EURASIA INN 7743068844 Moscow 10.01.2003 | 279,0 | 3 620,1 | 31,2 | 1,34 | 229 High |
| NAO CODE OF TRADE INN 7710601954 Moscow 05.10.2005 | 785,8 | 4 061,9 | 277,8 | 1,18 | 212 High |
| LLC BRIGHTMEDIA INN 7707600213 Moscow 07.09.2006 | 123,7 | 3 497,5 | 12,8 | 1,13 | 259 High |
| LLC PRO MEDIA ADVERTISING AGENCY INN 7701320731 Moscow 26.12.2002 | 6,4 | 11 256,9 | 189,7 | 1,05 | 210 High |
| Total for TOP-10 group of companies | 4 756,2 | 61 845,0 | |||
| Total for TOP-500 group of companies | 14 026,8 | 326 492,1 | |||
| Average value within TOP-10 group of companies | 475,6 | 6 184,5 | 18,4 | 2,21 | |
| Average value within TOP-500 group of companies | 140,3 | 3 264,9 | 27,4 | 0,30 | |
| Industry average value | 1,2 | 24,3 | -15,3 | 1,30 |
In 2015, the average value of current liquidity ratio within TOP-10 and TOP-500 groups of companies is not within recommended values. However, the ratio in TOP-10 group is within practical values (green, yellow and red color in Table 1 and Picture 1 accordingly).
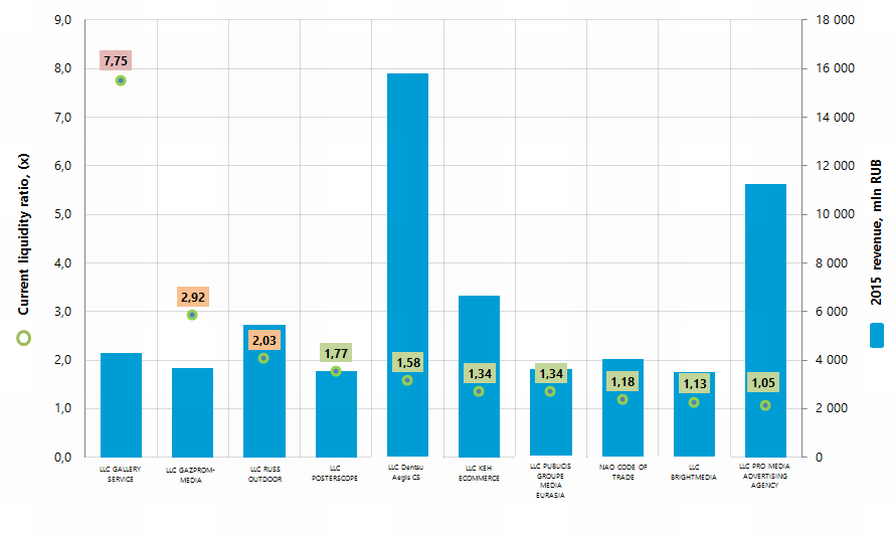 Picture 1. Current liquidity ratio and revenue of the largest Russian advertising agencies (TOP-10)
 In 2015 total revenue of 10 largest companies amounted to 19% from TOP-500 total revenue. This fact testifies the high level of competition within industry. Thus, total revenue of the largest company within industry LLC Dentsu Aegis CS amounted only to 5% from TOP-500 total revenue (Picture 2).
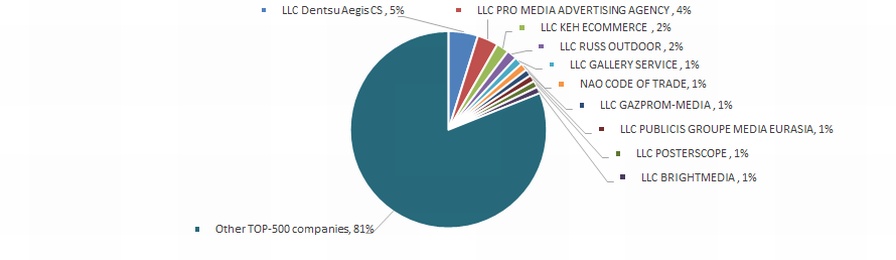 Picture 2. The shares of TOP-10 companies in TOP-500 total revenue for 2015, %
Nine companies from TOP-10 list have high solvency index Globas®, this fact shows the ability of the companies to meet their obligations in time and fully.
LLC GALLERY SERVICE has satisfactory solvency index Globas® due to due to participation as a defendant in debt collection arbitration proceedings and cases of untimely fulfillment of their obligations and unclosed enforcement lists. The forecast for index development is stable.
In 2015, seven companies from TOP-10 have decrease in revenue and net profit in comparison with previous period (red color in Table 1).
In 2014, the TOP-500 list included 41 loss-making companies and in 2015, the number decreased to 33. Meanwhile, their average loss increased more than twice. The average profit of other companies from TOP-500 list decreased by 9,6% for the same period (Picture 3).
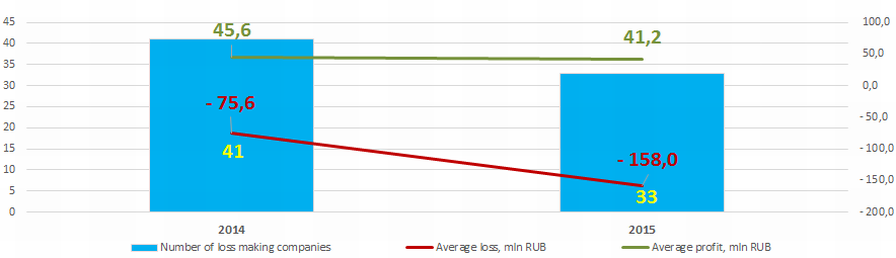 Picture 3. The number of loss-making companies and their average loss, average profit within TOP-500 group of companies in 2014 – 2015.
The industry average values of current liquidity ratio (Picture 4) are within recommended values, with the exception of 2006.
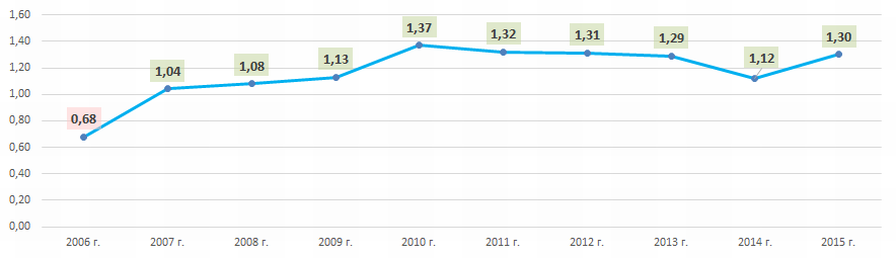 Picture 4. The industry average values of current liquidity ratio of the largest Russian advertising agencies in 2006-2015
In general, the industry ratios in monetary terms have positive dynamic with values exceeding macroeconomic indicators for the economy as a whole; this testifies the data from the Federal State Statistics Service (Picture 5).
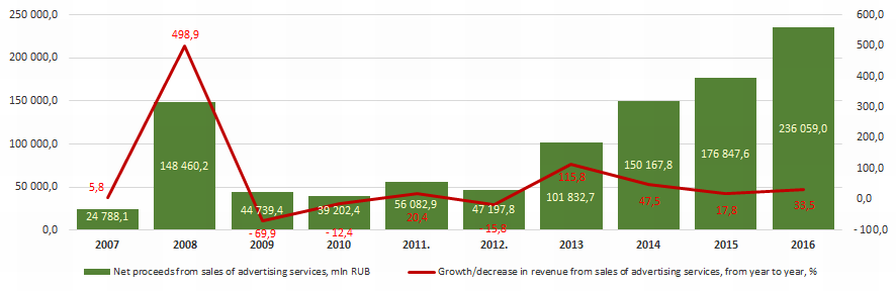 Picture 5. Net proceeds from sales of advertising services (except value added tax, excises and other similar compulsory payments), mln RUB and growth (decline) rate of revenue, from year to year, %
From 1991 to 2014 the increasing interest in advertising market is observed. This fact is confirmed by data from the Information and Analytical system Globas®, according to which 26% of companies from TOP-500 list in terms of 2015 revenue were founded in 2013 and 2014 (Picture 6).
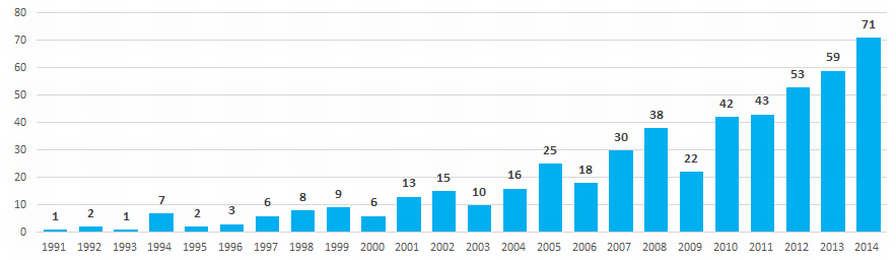 Picture 6. Distribution of 500 largest Russian advertising agencies by year of foundation
Advertising agencies are unequally distributed across the country. The maximum concentration is observed in Moscow - the largest financial center of the country. This fact is confirmed by data from the Information and Analytical system Globas®, according to which 500 largest companies in terms of 2015 revenue are registered in 30 Russian regions (Picture 7).
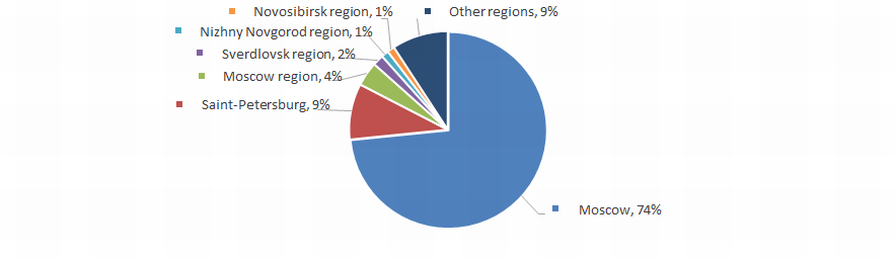 Picture 7. Distribution across the country of 500 largest Russian advertising agencies