
Order a report
Custom-made industry research, company ratings, competitor analysis


Net profit ratio of the largest Russian livestock farms
Information Agency Credinform has prepared the ranking of the largest Russian livestock farms.
The largest enterprises (TOP-10) in terms of revenue were selected according to the data from the Statistical Register for the latest available period (for the year 2014). Then, the companies were ranged by decrease in net profit ratio (Table 1).
Net profit ratio (%) is calculated as a ratio of net profit (loss) to sales revenue. The ratio reflects the company’s level ofsales profit.
The ratio doesn’t have the standard value. It is recommended to compare the companies within the industry or the change of a ratio in time for a certain company. The negative value of the ratio indicates about net loss. The higher is the ratio value, the better the company operates.
For the most full and fair opinion about the company’s financial position, not only financial ratios should be taken into account, but also the whole set of financial indicators and ratios.
| Name, INN, Region | 2014 netprofit, mln RUB | 2014 revenue, mln RUB | 2014/2013 revenue, % | Net profit ratio, % | Solvency index Globas-i |
|---|---|---|---|---|---|
| LLC SVINOKOMPLEX SAFONOVSKIY INN 3109004344 Belgorod region |
2 054,7 | 4 225,6 | 143 | 48,63 | 600 Unsatisfactory |
| LLC TAMBOV BACON INN 6803629911 Tambov region |
4 702,8 | 9 829,3 | 387 | 47,84 | 260 High |
| LLC CHERKIZOVO-SVINOVODSTVO INN 4812042756 Lipetsk region |
2 038,1 | 5 062,2 | 157 | 40,26 | 241 High |
| NAO SVINOKOMPLEX URALSKIY INN 6658238860 Sverdlovsk region |
1 626,0 | 4 279,5 | 162 | 38,00 | 241 High |
| LLC SVINOKOMPLEX KALINOVSKIY INN 3115006318 Belgorod region |
2 097,6 | 5 665,7 | 126 | 37,02 | 208 High |
| LLC KAMSKIY BACON INN 1650128842 Republic of Tatarstan |
1 568,5 | 5 254,2 | 172 | 29,85 | 220 High |
| ZAO TROPAREVO INN 5028001885 Moscow region |
1 175,9 | 4 325,7 | 155 | 27,18 | 157 The highest |
| JSC SIBERIAN AGRARIAN GROUP INN 7017012254 Tomsk region |
732,2 | 5 587,4 | 135 | 13,10 | 214 High |
| GESCHLOSSENE AKTIENGESELLSCHAFT ALEKSEEVSKY BACON INN 3122506583 Belgorod region |
593,0 | 5 634,4 | 184 | 10,52 | 236 High |
| NAO SVINOKOMPLEX KOROCHA INN 3110009570 Belgorod region |
0,8 | 41 521,0 | 149 | 0,0019 | 248 High |
The leader of the ranking by 2014 revenue NAO SVINOKOMPLEX KOROCHA takes the last place of the list. Despite the fact, that the company’s share in total revenue of TOP-10 amounted to 45%, its net profit decreased by almost a thousand times in comparison with the previous period and amounted to 844 th RUB. In this regard the net profit ratio value amounted to 0,0019%, i.e. almost near zero values.
The highest net profit ratio has LLC SVINOKOMPLEX SAFONOVSKIY (48,63%). However, the company has unsatisfactory solvency index Globas-i due to the upcoming liquidation in connection with its merger with another legal entity within the structural changes in Agro-industrial holding Miratorg, the owner of the company.
Other 9 participants of the ranking have the highest and high solvency index Globas-i, that shows the ability of enterprises to meet their obligations in time and fully.
Picture 1. Net profit ratio and revenue of the largest Russian livestock farms (TOP-10)
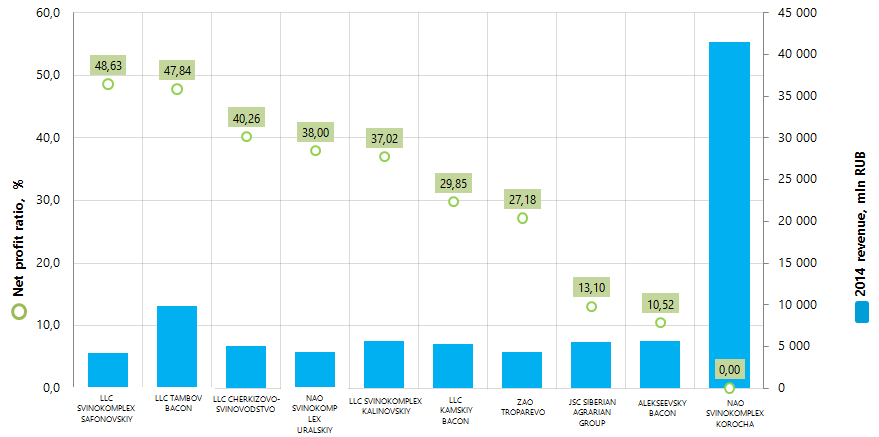
According to 2014 results, the total revenue of TOP-10 enterprises amounted to 91,4 bln RUB, that is 77% more than in 2013. Meanwhile the revenue growth of TOP-100 companies during the same period amounted to 46%, this may indicate about the trend of concentration of production in large enterprises within the industry. This is also testified by a comparison of average values of net profit ratio within group of companies: 29,24% (TOP-10) against 17,44% (TOP-100).
The industry as a whole demonstrates impressive 2014 results against the background of the economic situation in the country. This testifies the data from the Federal State Statistics Service (Pictures 2, 3 and 4).
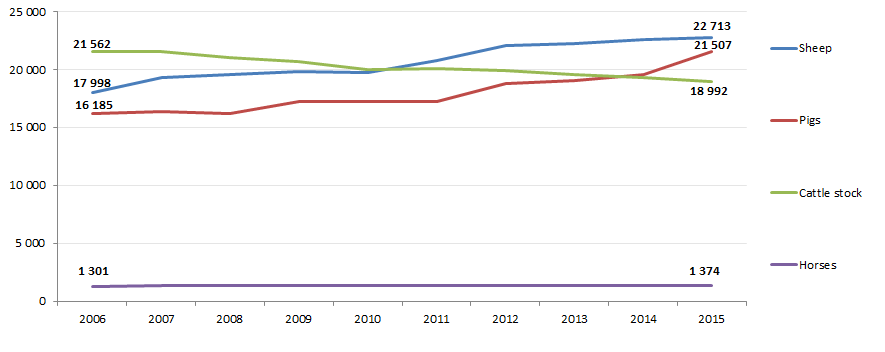
The growth of livestock population within 10 years amounted to 33% (pigs), 26% (sheep), 6% (horses). The population of cattle stock decreased by 12%.
Picture 3. The growth of main types of farm animals for slaughter in slaughter weight within farms of all categories (per year, th tons)
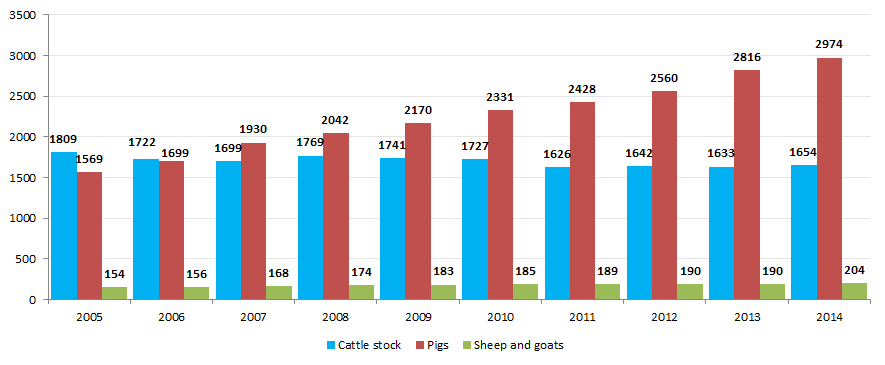
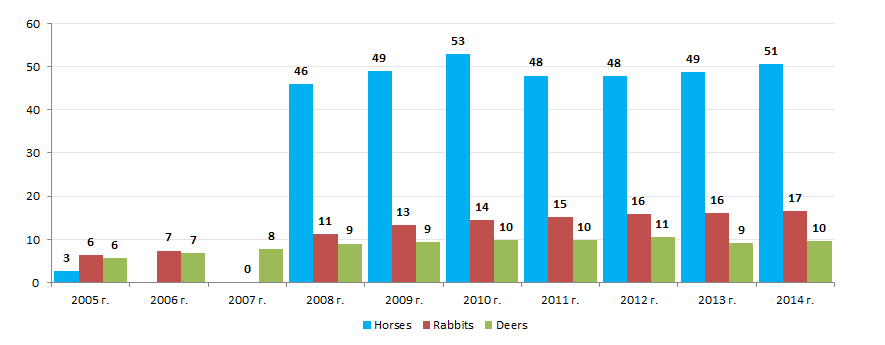
Similar results can be seen among the indicators of livestock production in slaughter weight; within 10 years the growth in pig breeding amounted to 1,9 times, sheep and goat breeding - 1,3 times, dear breeding - 1,7 times, rabbit breeding - 2,6 times, horse breeding - 18,7 times. The indicator decreased by 9% only in cattle breeding.
Picture 4. The growth of other farm animals for slaughter in slaughter weight within farms of all categories (per year, th tons)
Livestock breeding is characterized by relatively equal concentration of enterprises across the country; this fact is confirmed by the data from the Information and analytical system Globas-i on distribution across the country of 100 largest registered companies of the industry in terms of 2014 revenue (TOP-11 of regions).
| Region | Number of enterprises |
|---|---|
| Belgorod region | 16 |
| Leningrad region | 9 |
| Moscow region | 6 |
| Krasnodar region | 5 |
| Oryol region | 5 |
| Tyumen region | 5 |
| Sverdlovsk region | 4 |
| Altai region | 3 |
| Kaliningrad region | 3 |
| Kemerovo region | 3 |
| Kursk region | 3 |
Instruments allowing to cut expenses
The Government and the expert community from time to time are coming back to the topic of necessity to support business in financial and time costs cutting that an entrepreneur has to bear under reliability investigation of current or potential partners. Such support is possible by means of legislation development.
For example, the Central Bank of the RF for the purposes of anti-money laundering and terrorism financing (AML/TF) demands financial organizations to identify clients, representatives of clients, beneficiaries and beneficial owners. The Federal Financial Monitoring Service is charged with similar functions that can request and receive information about beneficial owners of legal entities and individual entrepreneurs` clients.
The Federal Tax Service of the RF, realizing the AML/TF task demands business entities before entering into business transactions to take measures of «Due Diligence and Care» by investigating contractors for corresponding to certain criteria using as well open data sources and specified data bases.
Russian business more frequently applies for compliance method – orientation to the world`s best practices and standards. Compliance represents correspondence to internal and external demands and standards: legislative requirements, regulatory documents, rules and standards of supervisory authorities, industry associations and self-regulating organizations, codes of behavior etc.
Under the conditions of economic reconstruction to new forms of development, instruments helping business to keep rules, demands, standards and assisting to cost cutting become currently important. It should be noted that the Information and analytical system Globas-i in a meaningful way helps to keep the above-mentioned demands of legislation and regulatory acts. First of all it is a data base of legal entities and individual entrepreneurs and also:
- Business information source
- Instrument for different business tasks and taking primary management decisions
- Complex on prevention for business activities risks
Among solvable business tasks – investigation of Russian and foreign contractors; financial analysis and solvency assessment; identification of frauds, potential bankrupts,fly-by-night companies; analysis of government contracts, purchases, tenders; assessment of claim load; analysis of competitive environment, industry state; ultimate beneficiary detection etc.
The government for its part also attempts to help business in costs cutting, while current legislation imposes limitations on receiving information about business entities and by that makes difficult the possibility to get full information and estimate potential constant contractors.
Shortly the Ministry of Economic Development and Trade estimates actual effect of legislation on business efficiency. At the first stage 239 regulatory legal acts will be examined. Quite possibly that some acts will fail the investigation.