
Order a report
Custom-made industry research, company ratings, competitor analysis


Trends in sale of building materials
Information agency Credinform represents an overview of activity trends of the largest Russian wholesalers of building materials.
The wholesalers of timber, construction materials and sanitary equipment with the largest volume of annual revenue (TOP-1000) were selected for the analysis, according to the data from the Statistical Register for the latest available periods (for 2013 - 2018). The analysis was made on the basis of the data of the Information and Analytical system Globas.
Net assets value is an indicator, reflecting the real value of company’s property, is calculated annually as the difference between assets on the enterprise balance and its debt obligations. The indicator of net assets is considered negative (insufficiency of property), if company’s debt exceeds the value of its property.
The largest enterprise of the Central economic region of Russia in terms of net assets is NATIONAL AGGREGATES COMPANY NJSC, INN 7716614075, Moscow. Its net assets amounted to 7 billion rubles in 2018.
The smallest amount of net assets in the TOP-1000 list was hold by LES EXPORT NJSC, INN 2536069294, Primorye territory. The insufficiency of property of this company in 2018 was expressed as a negative value of -6 billion rubles.
The average values of net assets tend to increase over the ten-year period (Picture 1).
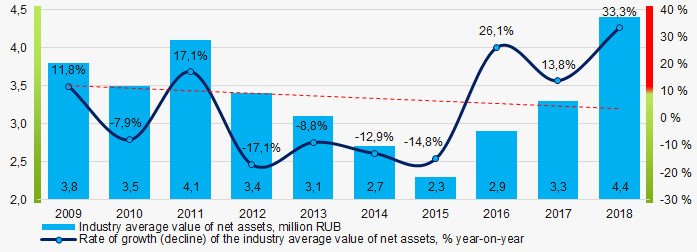 Picture 1. Change in the industry average indicators of the net assets value in 2009 – 2018
The shares of TOP-1000 enterprises with insufficiency of assets have a tendency to decrease in the last five years (Picture 2).
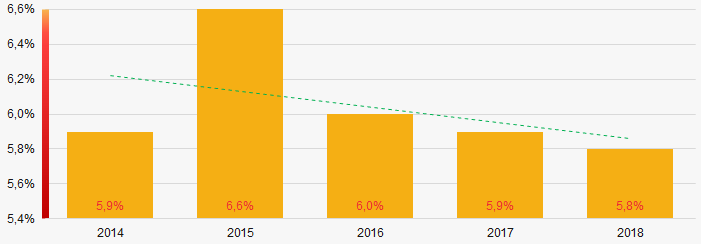 Picture 2. Shares of enterprises with negative values of net assets in TOP-1000
Sales revenue
The revenue volume of 10 leading companies of the region made more than 21% of the total revenue of TOP-1000 in 2018 (Picture 3). It points to a high level of intraindustry competition.
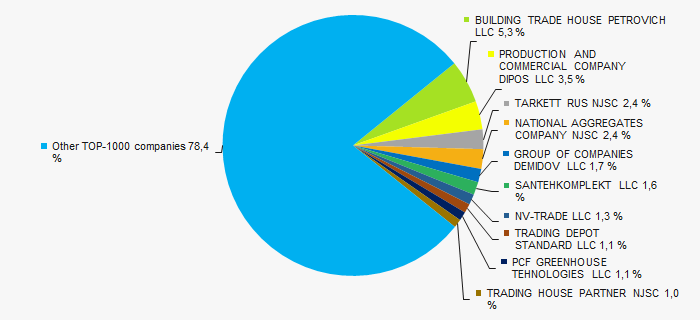 Picture 3. Shares of participation of TOP-10 companies in the total revenue of TOP-1000 enterprises for 2018
 In general, there is a tendency to increase in the revenue volumes (Picture 4).
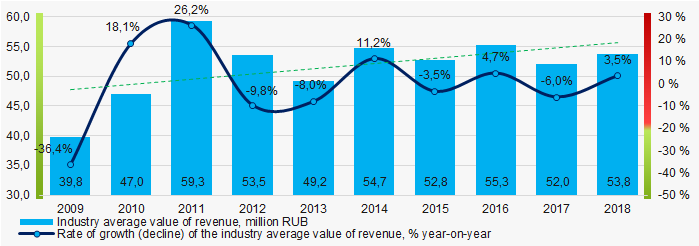 Picture 4. Change in the industry average revenue in 2009 – 2018
 Profit and losses
The largest company in terms of net profit value is NATIONAL AGGREGATES COMPANY NJSC, INN 7716614075, Moscow. Company's profit amounted 2,6 billion rubles in 2018.
Industry average indicators of net profit trends to increase over a ten-year period (Picture 5).
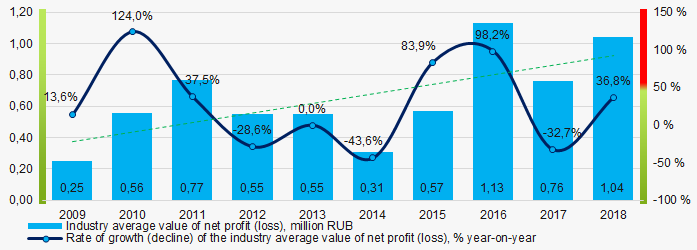 Picture 5. Change in the industry average indicators of net profit (loss) in 2009 – 2018
Average values of net profit’s indicators of TOP-1000 companies increase for the five-year period, at the same time the average value of net loss decreases (Picture 6).
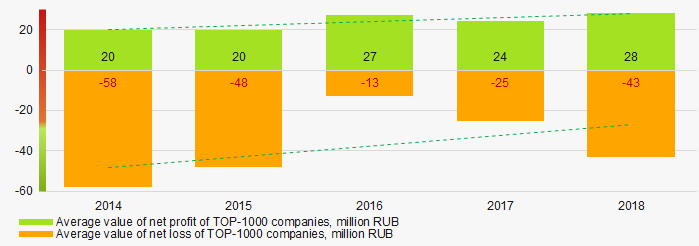 Picture 6. Change in the average values of indicators of net profit and net loss of TOP-1000 companies in 2014 – 2018
Key financial ratios
Over the ten-year period the industry average indicators of the total liquidity ratio were in the range of recommended values - from 1,0 up to 2,0, with a tendency to increase (Picture 7).
The total liquidity ratio (the relation of the amount of current assets to short-term liabilities) shows the sufficiency of company’s funds for repayment of its short-term liabilities.
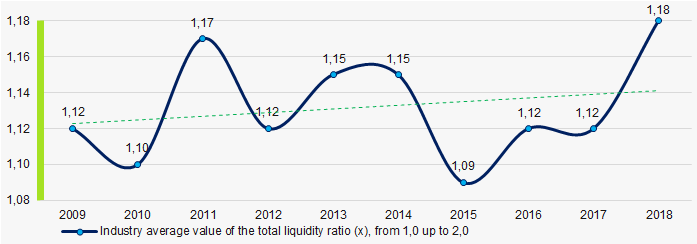 Picture 7. Change in the industry average values of the total liquidity ratio in 2009 – 2018
 The industry average values of the return on investment ratio trend to increase for ten years (Picture 8).
The ratio is calculated as the relation of net profit to the sum of own capital and long-term liabilities and demonstrates the return on the equity of own capital involved in the commercial activity and the long-term borrowed funds of an organization.
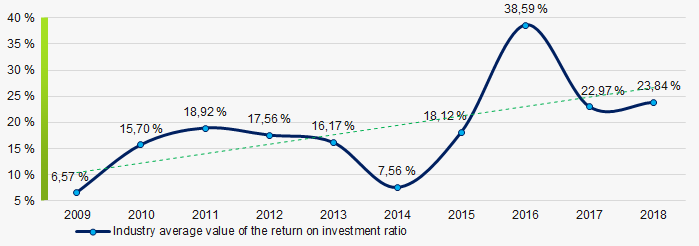 Picture 8. Change in the industry average values of the return on investment ratio in 2009 – 2018
 Asset turnover ratio is calculated as the relation of sales proceeds to the average value of total assets for a period and characterizes the efficiency of use of all available resources, regardless of the sources of their attraction. The ratio shows how many times a year a complete cycle of production and circulation is made, yielding profit.
This ratio of business activity trends to decrease over ten-year period (Picture 9).
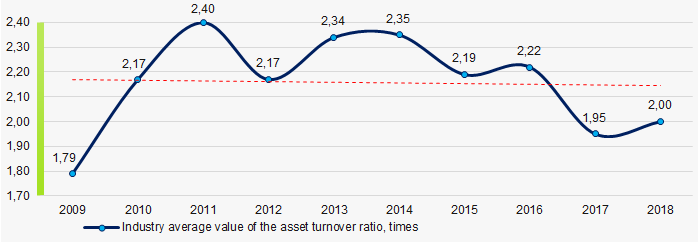 Picture 9. Change in the industry average values of the asset turnover ratio in 2009 – 2018
 Small business
81% of TOP-1000 companies are registered in the Register of small and medium-sized enterprises of the Federal Tax Service of the RF. At the same time, their share in the total revenue of TOP-1000 amounted to 44%, that twice as high as the national average one (Picture 10).
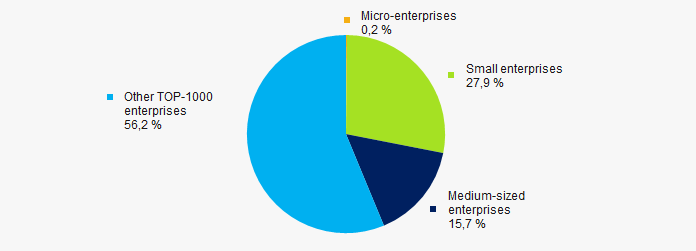 Picture 10. Shares of proceeds of small and medium-sized enterprises in TOP-1000 companies
Main regions of activity
TOP-1000 companies are registered in 72 regions and distributed unequal across Russia. Almost 54% of the largest enterprises in terms of revenue are concentrated in metropolitan area – Moscow and its region, as well as in Saint Petersburg (Picture 11).
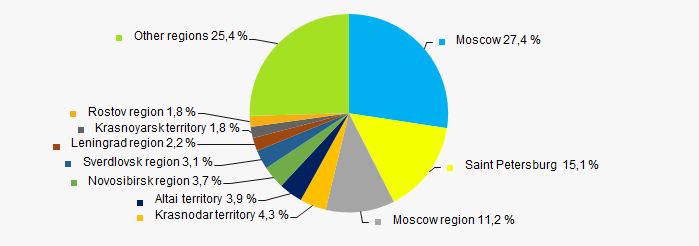 Picture 11. Distribution of the revenue of TOP-1000 companies by Russian regions
Financial position score
An assessment of the financial position of TOP-1000 companies shows that the financial position of the most of them is above average. (Picture 12).
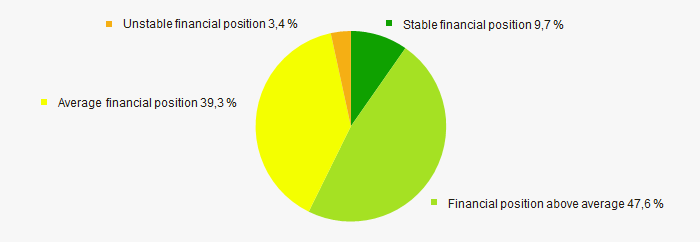 Picture 12. Distribution of TOP-1000 companies by financial position score
Solvency index Globas
The most of TOP-1000 enterprises got Superior/High or Strong/Medium Solvency index Globas, that points to their ability to pay off their debts in time and fully (Picture 13).
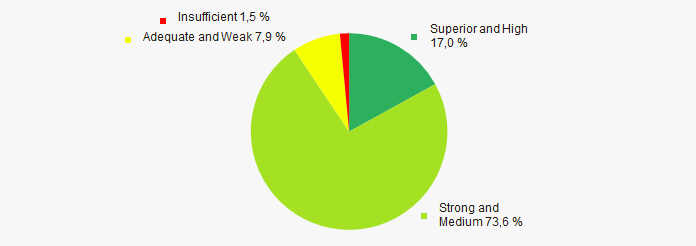 Picture 13. Distribution of TOP-50 companies by solvency index Globas
According to the Federal State Statistics Service, the share of enterprises of the industry in the total amount of revenue from the sale of goods, products, works, services made 0,34% countrywide for 2018, that is lower than the indicator for 2019, which amounted to 0,347%.
Conclusion
A comprehensive assessment of activity of the largest Russian wholesalers of building materials, taking into account the main indices, financial indicators and ratios, points to the prevalence of positive trends (Table 1).
| Trends and evaluation factors | Specific share of factor, % |
| Rate of growth (decline) in the average size of net assets | |
| Increase / decrease in the share of enterprises with negative values of net assets | |
| Level of competition / monopolization | |
| Rate of growth (decline) in the average size of revenue | |
| Rate of growth (decline) in the average size of profit (loss) | |
| Growth / decline in average values of net profit of TOP-1000 companies | |
| Growth / decline in average values of net loss of TOP-1000 companies | |
| Increase / decrease in average values of total liquidity ratio | |
| Increase / decrease in average values of return on investment ratio | |
| Increase / decrease in average values of asset turnover ratio, times | |
| Share of small and medium-sized enterprises in terms of revenue being more than 21% | |
| Regional concentration | |
| Financial position (the largest share) | |
| Solvency index Globas (the largest share) | |
| Dynamics of the share of proceeds of the industry in the total revenue of the RF | |
| Average value of the specific share of factors | |
![]() positive trend (factor),
positive trend (factor), ![]() negative trend (factor).
negative trend (factor).