
Order a report
Custom-made industry research, company ratings, competitor analysis


Trends in the field of shipbuilding
Information agency Credinform observes tendencies in the sphere of shipbuilding.
The companies with the highest volume of revenue (TOP-10 and TOP-300) were selected for the ranking, according to the data from the Statistical Register for the latest available periods (2015 and 2016). Analysis was based on the data from the Information and Analytical system Globas.
Legal forms and unreliable data
The most widespread legal form in the industry is a Limited liability company. Significant shares make non-public and public joint-stock companies. (Picture 1).
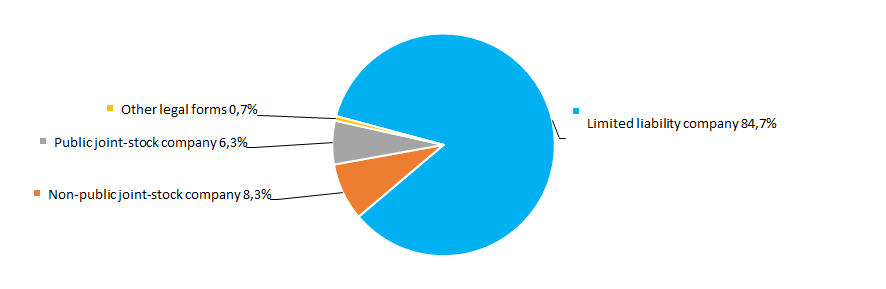 Picture 1. Distribution of TOP-300 companies by legal forms
Following the results of the investigations of the Federal Tax Service of the RF, 3,33% of companies in the industry are entered records about unreliable data to the Unified state register of legal entities (EGRUL) (Picture 2).
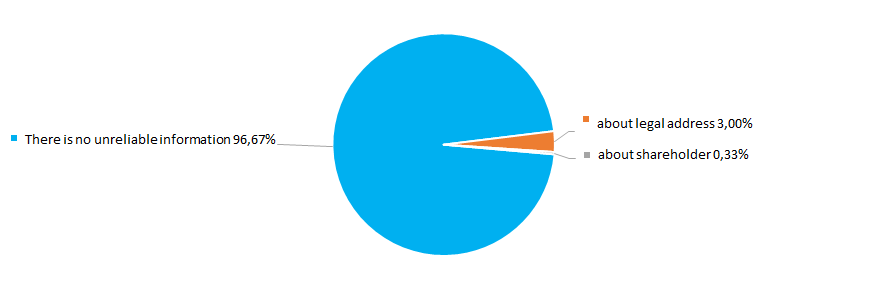 Picture 2. Shares of TOP-300 companies, with records in the EGRUL about unreliable data
 Sales revenue
Revenue of 10 leaders of the industry in 2016 was 82% from the total revenue of the 300 largest companies. This shows high level of monopolization in the industry. The largest company in terms of revenue volume in 2016 was JCS UNITED SHIPBUILDING CORPORATION - the largest shipbuilding holding in Russia, uniting about 40 planning and design offices and specialized scientific and research centers, shipyards, shipbuilding and enterprises. Major part of the national shipbuilding complex was consolidated on the basis of the above mentioned enterprises. (Picture 3).
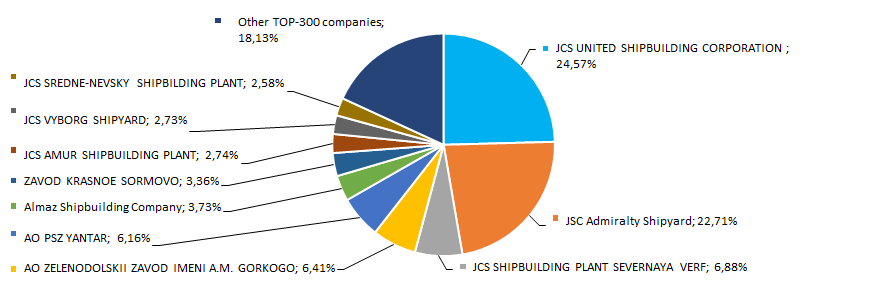 Picture 3. Shares of TOP-10 companies in the total revenue of 2016 of TOP-300
The best results in the industry in terms of revenue volume for a ten-year period were reached in 2016. During crisis periods in the economy in 2008, 2012 and 2013 average industrial values have significantly decreased. In general, the tendency for increasing of revenue volume is observed. (Picture 4).
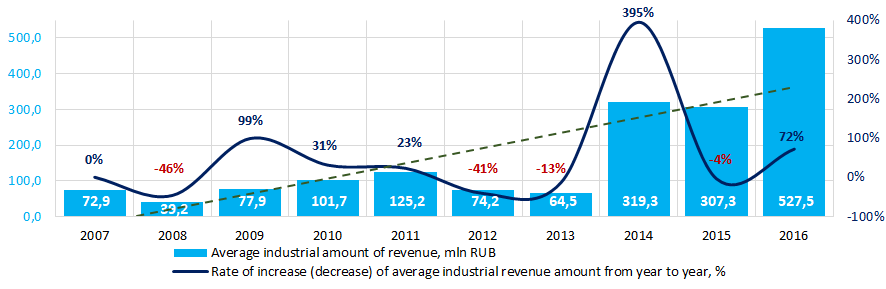 Picture 4. Change in average industrial values of revenue in the sphere of shipbuilding companies in 2007 – 2016
 Profit and loss
Profit volume of 10 leaders of the industry in 2016 was 92% of the total profit of TOP-300 companies. JSC ADMIRALTY SHIPYARD takes lead in 2016 in terms of profit volume - basic enterprise of the shipbuilding industry that is a part of JCS UNITED SHIPBUILDING CORPORATION and specializes in manufacture of demersal marine equipment, building of submarines, demersal facilities and knowledge intensive high technology ships for military and civilian usage. (Picture 5).
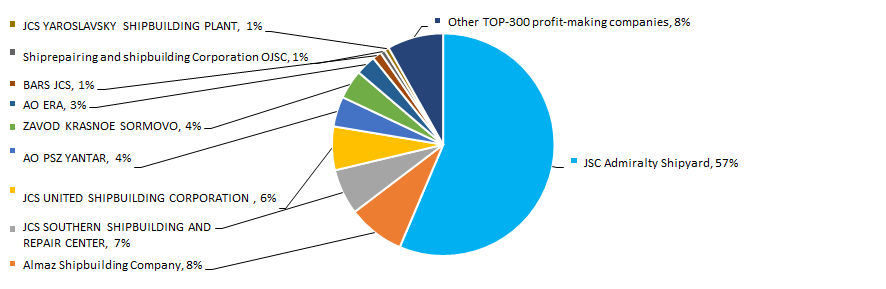 Picture 5. Shares of TOP-10 companies in the total profit volume of TOP-300 companies in 2016
Average industrial values of the companies` profit indicators for ten years are not stable. Negative values of the indicator were observed in 2013 and 2016. In general, profit indicators have decreasing tendency. The best results in the industry were shown in 2015. (Picture 6).
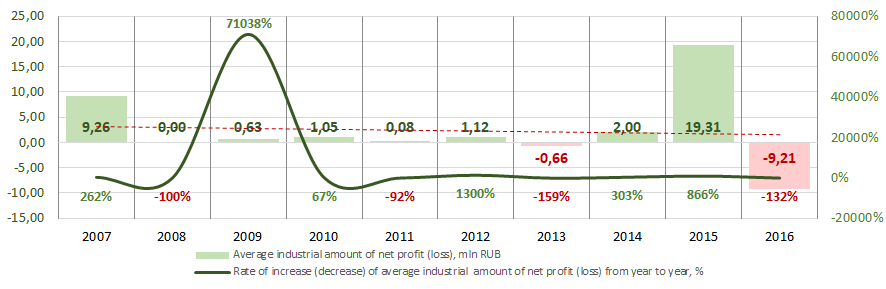 Picture 6. Change of the average industrial indicators of profit for shipbuilding companies in 2007 – 2016
 Among the TOP-300 group 72 loss-making companies were observed in 2015. The amount increased to 82 companies or by 14% in 2016. Besides, average amount of loss has 129% increased. For the rest of TOP-300 companies, average amount of profit has 35% decreased for the same period (Picture 7).
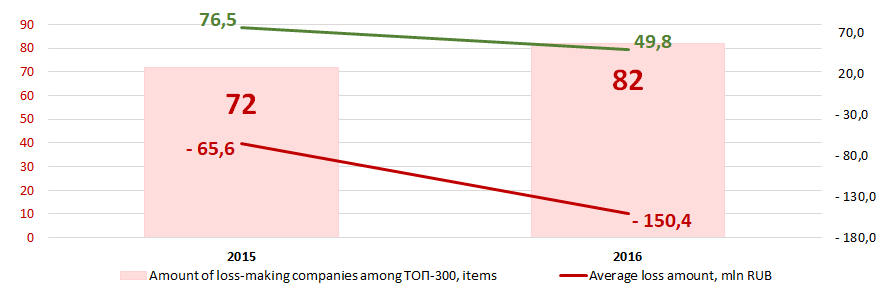 Picture 7. Amount of loss-making companies, average values of loss and profit for TOP-300 companies in 2015 – 2016
 Key financial ratios
For ten years average indicators of the current liquidity ratio in the industry were in the interval of the recommended values - from 1,0 to 2,0 and higher, except for 2010. In general, indicator of the ratio has increasing tendency.
Current liquidity ratio (the relation of the amount of current assets to short-term liabilities) shows the sufficiency of company’s funds for repayment of its short-term liabilities.
Solvency ratio (equity to balance sheet amount) shows the dependence of the company on external loans. The recommended value: >0,5. A value less than a minimum one indicates high dependence on external sources of funds.
A calculation of practical values of financial ratios, which might be considered as normal for a certain industry, has been developed and implemented in the Information and Analytical system Globas by the experts of Information Agency Credinform, having taken into account the current situation in the economy as a whole and in the industries. For shipbuilding industry practical value of the solvency ratio is from 0,02 to 0,85 in 2016.
For a ten-year period average indicators of the ratio were lower than recommended values for eight years and in the interval of practical values for the whole period (Picture 8).
In the whole, indicator of the ratio has decreasing tendency.
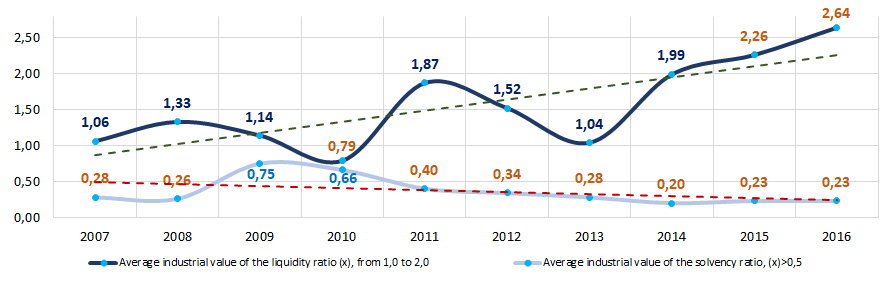 Picture 8. Change of average industrial values of the current liquidity and solvency ratios for shipbuilding companies in 2007 – 2016
 During ten years unstable indicators of the return on investments ratio with decreasing tendency were observed. In 2013 and 2016 indicators decreased to negative values (Picture 9). The ratio is net profit to the total equity and long-term liabilities and demonstrates profit from the equity involved into commercial activities and long-term external funds of the company.
For the same period indicators of the product profitability ratio were also unstable (Picture 9).
The ratio is sales revenue to expenses from ordinary activities. Totally, profitability indicates the economic efficiency of production.
In general, indicator of the ratio demonstrates increasing tendency.
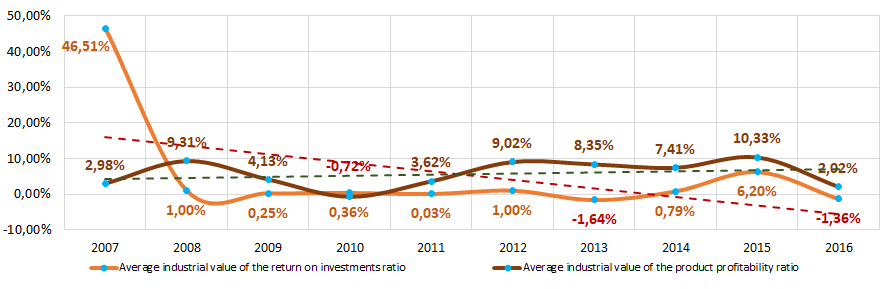 Picture 9. Change of average industrial values of the return on investments and the product profitability ratios for shipbuilding companies in 2007 – 2016
 The assets turnover ratio is sales revenue to average total assets for a period and characterizes the effectiveness of using of all available resources, regardless the source of their attraction. The ratio shows how many times per year the full cycle of production and circulation is performed, generating profit.
The equity turnover ratio is calculated as a ratio of revenue to yearly average sum of equity and demonstrates the company’s usage rate of total assets.
For ten years both ratios of business activity demonstrated were instable with decreasing tendency (Picture 10).
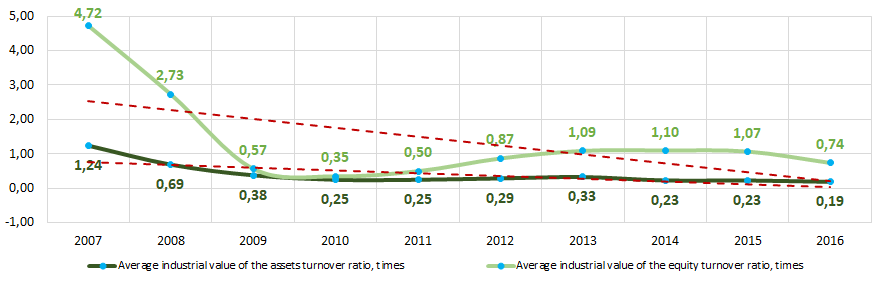 Picture 10. Change of average industrial values of the business activity ratios for shipbuilding companies in 2007 – 2016
 Production structure
Major part of TOP-300 companies specializes in manufacture of leisure and sports vessels (Picture 11).
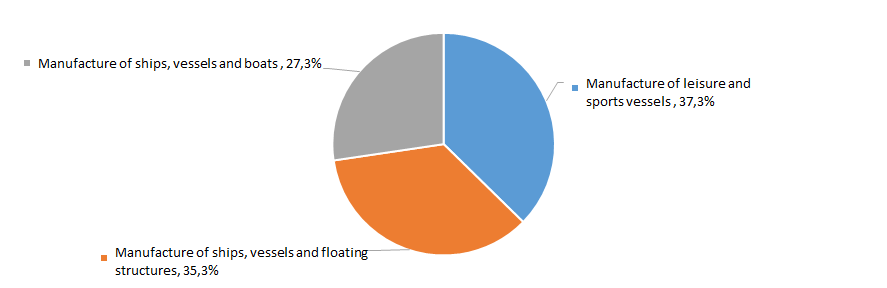 Picture 11. Distribution of TOP-300 companies by types of output, %
Dynamics of business activity
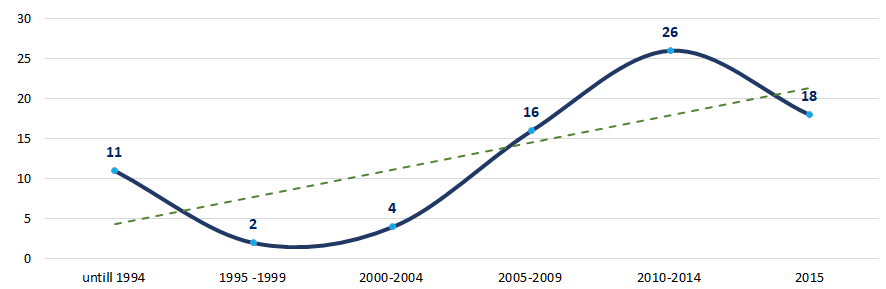
Over a 25-year period, the registered companies from TOP-300 list are unequally distributed by the year of foundation. Most of companies in the industry were founded in 2010. In general, increasing tendency for amount of registered companies is observed. (Picture 12).
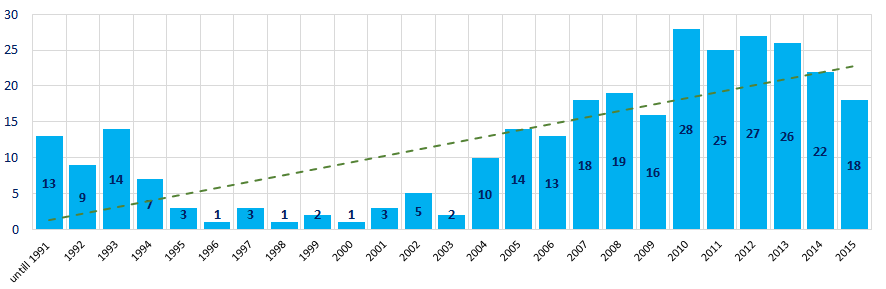 Picture 12. Distribution of TOP-300 companies by years of foundation
 Outstanding interest for shipbuilding industry was paid in 2010 - 2014. (Picture 13).
 Picture 13. Average amount of TOP -300 companies, registered per year, in terms of foundation periods
 Main regions of activity
Marine fishery companies are distributed unequally on the territory of the country. Most of the companies are registered in Saint-Petersburg – historically developed, the largest center of shipbuilding industry in the country (Picture 14).
TOP-300 companies are registered in 41 regions of Russia.
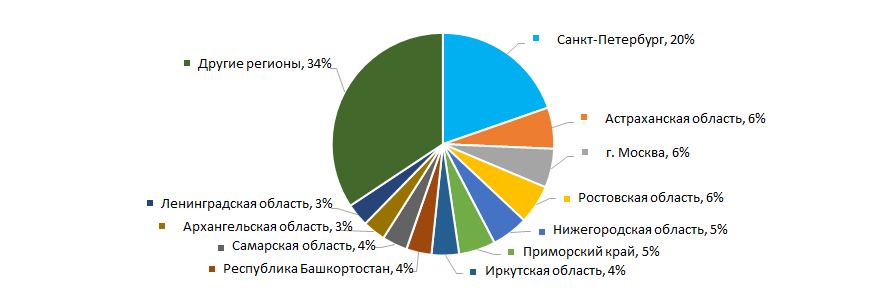 Picture 14. Distribution of TOP -300 companies throughout regions of Russia
The majority of shipbuilding companies is centered in the Northwestern Federal District of the RF (Picture 15).
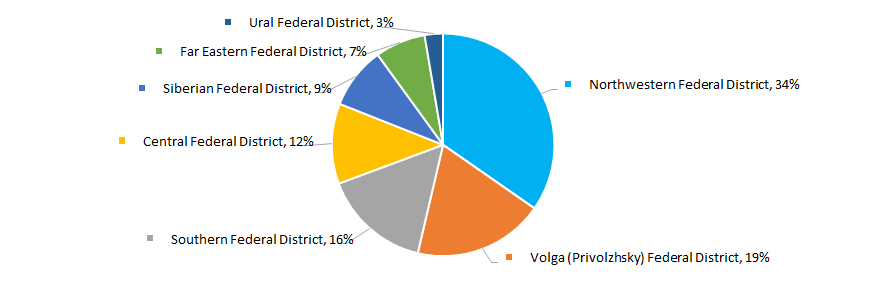 Picture 15. Distribution of TOP-300 companies throughout federal districts of Russia
Share of companies from the TOP -300 group, having branches or representative offices, amounts to 6%.
Participation in arbitration proceedings
Overwhelming majority of companies in the industry does not participate in arbitration proceedings or participate inactively (Picture 16).
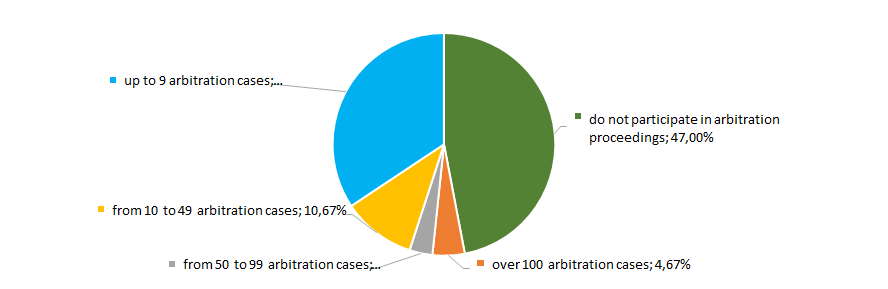 Picture 16. Distribution of TOP -1000 companies by participation in arbitration proceedings
Reliability indexи
In terms of signs of «fly-by-night» or unreliable companies the majority of companies demonstrate extremely low risk of cooperation (Picture 17).
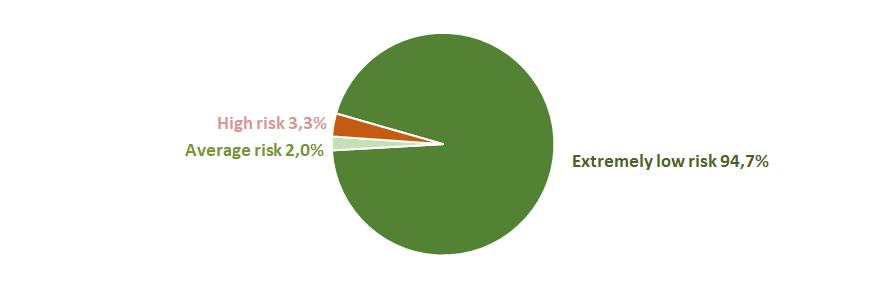 Picture 17. Distribution of TOP -300 by Reliability index
Financial position score
Assessment of financial state of the sector’s companies indicates that the most of the companies have an average financial standing (Picture 18).
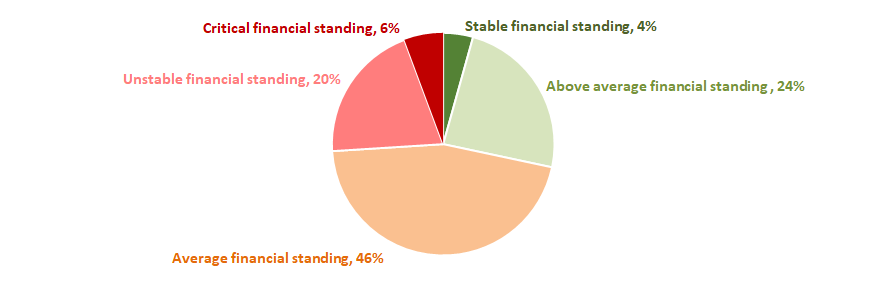 Picture 18. Distribution of TOP-300 companies by Financial position score
Liquidity index
Almost half of the sector`s companies (48%) demonstrate an extremely low or insignificant levels of bankruptcy risk in the short-term period. However, more than 20% of enterprises have the highest level of risk. (Picture 19).
 Picture 19. Distribution of TOP-300 companies by Liquidity index
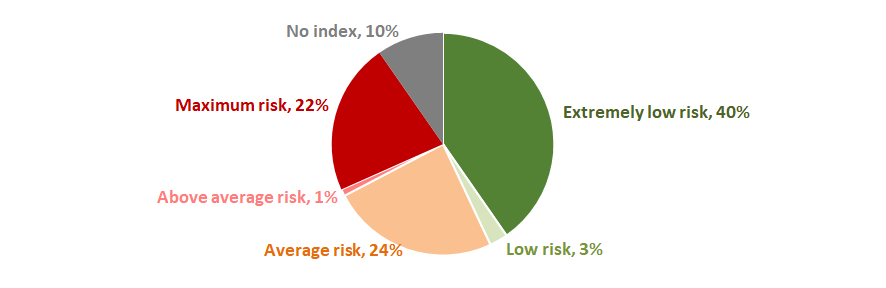
Solvency index Globas
Most of the TOP-300 companies have got from superior to medium Solvency index Globas (Picture 20). Besides, more than a third of companies have got adequate and weak Solvency index Globas
 Picture 20. Distribution of TOP -300 by Solvency index Globas
Therefore, complex assessment of shipbuilding companies, taking into accounts key indexes, financial figures and ratios, demonstrate unfavorable trends within the industry. However, the situation has recently begun stabilizing.