The consumer market is formed by purchasing power. The higher the purchasing power and economic well-being of the population, the more it spends. The more people spend, the more attractive the country is as a market for producers. The scale of the consumer market significantly defines the political weight and importance of the State in global trade.
One of the main criteria for assessing the attractiveness and potential of the consumer market for the international investors is the total amount of personal expenses of the population on goods, services, material goods, in other words – the final consumption of the private households.
In Top-20 ranking by the sum of personal expenses on goods and services, Russia takes the sixth place. In 2018 the local households spent 2 191 billion USD on goods and services.
The consumption in Russia has features that affect on the total amount. In particular, a significant proportion of natural self-sufficiency. This may include self-repair and maintenance of residential premises, as well as the consumption of goods obtained from own subsidiary husbandry. Statistics does not take into account such purchases.
The first three places in Top-20 take USA, China and India.
According to the 2018 results, the U.S. population spent 14 141 billion USD on goods and services, that is 18.1% of the expenditure of residents around the world (Table 1).
Despite the fact that China is 4.3 times ahead of USA in terms of population, the consumer market of China is estimated at a smaller amount of 9 603 billion USD.
India takes the third place with the sum of 6 198 billion USD.
№ | Country | Expenditure, billion USD | Share in global expenditure, % |
All countries | 78 289 | 100,0 | |
Top-20 | 56 759 | 72,5 | |
1 | USA | 14 141 | 18,1 |
2 | China | 9 603 | 12,3 |
3 | India | 6 198 | 7,9 |
4 | Japan | 3 133 | 4,0 |
5 | Germany | 2 309 | 2,9 |
6 | Russia | 2 191 | 2,8 |
7 | Brazil | 2 120 | 2,7 |
8 | Great Britain | 2 005 | 2,6 |
9 | Indonesia | 1 992 | 2,5 |
10 | Mexico | 1 696 | 2,2 |
11 | France | 1 600 | 2,0 |
12 | Italy | 1 462 | 1,9 |
13 | Turkey | 1 353 | 1,7 |
14 | Egypt | 1 141 | 1,5 |
15 | Spain | 1 081 | 1,4 |
16 | Canada | 1 065 | 1,4 |
17 | Republic of Korea | 1 025 | 1,3 |
18 | Pakistan | 936 | 1,2 |
19 | Nigeria | 935 | 1,2 |
20 | Iran | 773 | 1,0 |
Participants of Top-20 list accumulate 56 759 billion USD or 72.5% of all public expenditure on goods and services. The share of other countries is only 19 530 billion USD or 27,5% of global consumer market (Picture 1).
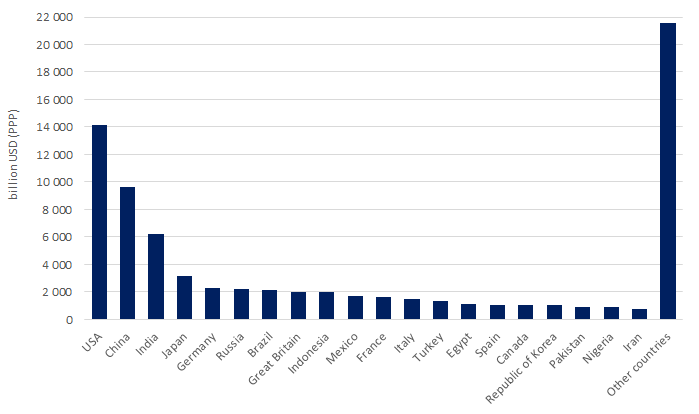
Information agency Credinform has prepared a review of trends of the largest Russian automotive companies.
The largest automotive companies (TOP-10 and TOP-1000) in terms of annual revenue were selected for the analysis according to the data from the Statistical Register for the latest available periods (2015-2017). The analysis was based on the data of the Information and Analytical system Globas.
Net assets are total assets less total liabilities. This indicator reflects the real value of the property of an enterprise. When the company’s debt exceeds the value of its property, the indicator is considered negative (insufficiency of property).
Position in TOP-1000, Name, INN, region, activity | Net assets value, billion RUB | Solvency index Globas | ||
2015 | 2016 | 2017 | ||
1 | 2 | 3 | 4 | 5 |
1 JSC KAMAZ INN 1650032058 Republic of Tatarstan Manufacture of cargo vehicles |
41,6 | 43,4 | 45,5 | 192 High |
2 LLC HYUNDAI MOTOR MANUFACTURING RUS INN 7801463902 Saint Petersburg Manufacture of motor vehicles |
16,1 | 22,0 | 28,8 | 209 Strong |
3 LLC VOLKSWAGEN GROUP RUS INN 5042059767 Kaluga region Manufacture of motor vehicles |
22,2 | 16,6 | 21,9 | 237 Strong |
4 JSC GAZ INN 5200000046 Nizhniy Novgorod Manufacture of other parts and accessories for motor vehicles |
23,2 | 23,7 | 20,6 | 210 Strong |
5 JSC RENAULT RUSSIA INN 7709259743 Moscow Manufacture of motor vehicles |
18,7 | 16,1 | 19,2 | 219 Strong |
996 JSC AVTOKRAN INN 3731024644 Ivanovo region Manufacture of special purpose vehicles Process of being wound up since 08.06.2017 |
-1,0 | -2,6 | -3,0 | 600 Insufficient |
997 JSC AUTOMOBILES AND MOTORS OF URAL INN 6658169550 Sverdlovsk region Manufacture of motor vehicles Process of being wound up since 17.02.2012 |
-3,9 | -3,9 | -4,2 | 600 Insufficient |
998 LLC FORD SOLLERS HOLDING INN 1646021952 Republic of Tatarstan Manufacture of motor vehicles |
4,0 | -19,2 | -32,9 | 311 Adequate |
999 JSC AVTOVAZ INN 6320002223 Samara region Manufacture of motor vehicles |
-43,1 | -51,4 | -64,2 | 267 Medium |
1000 JSC CHEBOKSARY AGGREGATE WORKS INN 2126001687 Republic of Chuvashia Manufacture of other parts and accessories for motor vehicles Case of recognition of the company’s bankruptcy is considered |
-2,0 | -6,8 | -105,4 | 550 Insufficient |
— growth of indicator in comparison with prior period, — growth of indicator in comparison with prior period.
For the last 10 years, the average values of net assets showed the decreasing tendency (Picture 1).
The shares of TOP-1000 companies with insufficient property are on a relatively high level with the trend to decrease over the past three years (Picture 2).
Sales revenue
In 2017, total revenue of 10 largest companies in the industry was 58% of TOP-1000 total revenue (Picture 3). This testifies relatively high level of monopolization in the industry.
In general, there is a trend to decrease in industry average revenue over the past 10 years (Picture 4).
Profit and loss
In 2017, profit of 10 largest companies in the region amounted to 54% of TOP-1000 total profit (Picture 5).
For the last ten years, the industry average net profit values were mainly in the negative zone. Thus, the companies’ net loss values have the trend to decrease (Picture 6).
For the three-year period, the average net profit values of TOP-1000 companies increase with the average net loss value having the increasing trend (Picture 7).
Key financial ratios
For the last ten years, since 2014 the average values of the current liquidity ratio were above the recommended one - from 1,0 to 2,0 with a trend to decrease (Picture 8).
Current liquidity ratio (current assets to short-term liabilities) shows the sufficiency of company’s assets to repay on short-term liabilities.
For the last ten years, the average values of ROI ratio have the trend to decrease (Picture 9).
ROI ratio is calculated as net profit to sum of shareholders equity and long-term liabilities, and shows the return of equity involved in commercial activities and long-term borrowed funds.
Assets turnover ratio is the ratio of sales revenue and company’s average total assets for a period. It characterizes the effectiveness of using of all available resources, regardless the source of their attraction. The ratio shows how many times per year the full cycle of production and circulation is performed, generating the corresponding effect in the form of profit.
For the last ten years, business activity ratio demonstrated the increasing trend (Picture 10).
Production structure
The highest share in total revenue of TOP-1000 falls for companies with broad specialization in the manufacture of motor vehicles (Picture 11).
71% companies of TOP-1000 are registered in the Register of small and medium-sized businesses of the Federal Tax Service of the Russian Federation. At the same time, their share in total revenue for 2017 amounted to only 5% that is much lower the national average (Picture 12).
Main regions of activity
Companies of TOP-1000 are located across the country quite equally, taking into account the specifics of industry production. The companies are registered in 65 districts. The highest shares of revenue volume are concentrated in the Republic of Tatarstan, Saint Petersburg, Samara region and Kaluga region (Picture 13).
Financial position score
Assessment of the financial position of TOP-1000 companies shows that the majority of them have average financial position (Picture 14).
Solvency index Globas
Most of TOP-1000 companies got Superior / High and Strong / Medium index Globas. This fact shows their ability to meet their obligations fully (Picture 15).
Index of industrial production
According to the Federal State Statistics Service (Rosstat), during 12 months of 2018, the trend to decrease of industrial production indexes is observed (Picture 16). The average month-to-month figure WAS 101,7%.
Conclusion
Complex assessment of activity of the largest automotive companies, taking into account the main indexes, financial ratios and indicators, demonstrates the prevalence of negative trends in the industry (Table 2).
Trends and evaluation factors | Relative share of factors, % |
Rate of growth (decline) in the average size of net assets | -10 |
Increase / decrease in the share of enterprises with negative values of net assets | 5 |
Rate of growth (decline) in the average size of revenue | -10 |
Concentration level of capital | -5 |
Rate of growth (decline) in the average size of profit (loss) | -10 |
Growth / decline in average values of companies’ net profit | 10 |
Growth / decline in average values of companies’ net loss | -10 |
Increase / decrease in average values of total liquidity ratio | -5 |
Increase / decrease in average values of return on investment ratio | -10 |
Increase / decrease in average values of asset turnover ratio, times | 10 |
Share of small and medium-sized businesses in the region in terms of revenue being more than 22% | -10 |
Regional concentration | 5 |
Financial position (the largest share) | 5 |
Solvency index Globas (the largest share) | 10 |
Industrial production index | -5 |
Average value of relative share of factors | -2,0 |
— positive trend (factor), — negative trend (factor).