
Order a report
Custom-made industry research, company ratings, competitor analysis


Trends in microlending
Information agency Credinform has prepared a review of trends of the largest microlending companies.
Companies granting loans and other credits, and being largest (TOP-10 and TOP-1000) in terms of annual revenue were selected for the analysis according to the data from the Statistical Register for the latest available periods (2015-2017). The analysis was based on the data of the Information and Analytical system Globas.
Net assets are total assets less total liabilities. This indicator reflects the real value of the property of an enterprise. When the company’s debt exceeds the value of its property, the indicator is considered negative (insufficiency of property).
The largest company in term of net assets is LLC IST-KAPITAL, INN 7801503432. In 2018, net assets value of the company exceeded 14 billion RUB.
The lowest net assets volume among TOP-100 belonged to LLC AKTIV S, being in process of reorganization in the form of acquisition since 23.08.2019, INN 7826718207. In 2018, insufficiency of property of the company was indicated in negative value of -1,1 billion RUB.
Covering the ten-year period, the average net assets values have a trend to increase (Picture 1).
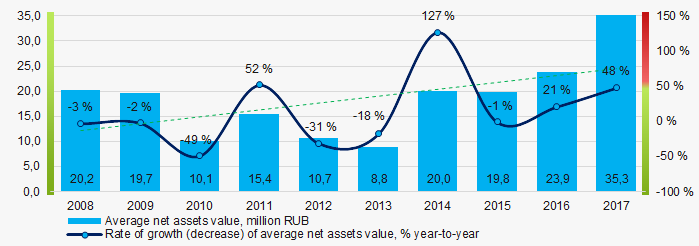 Picture 1. Change in average net assets value in 2008 – 2017
The shares of TOP-1000 companies with insufficient property have trend to decrease over the past five years (Picture 2).
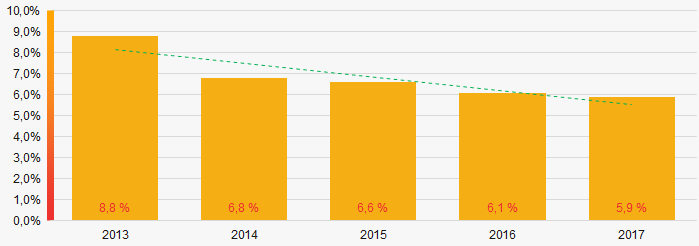 Picture 2. Shares of companies with negative net assets value in TOP-1000, 2013-2017
Sales revenue
In 2017, total revenue of 10 largest companies of was almost 49% of TOP-1000 total revenue (Picture 3). This testifies high level of monopolization in the industry.
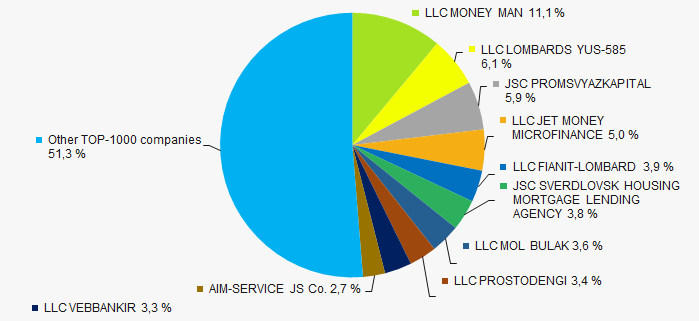 Picture 3. Shares of TOP-10 companies in TOP-1000 total profit for 2017
Covering the ten-year-period, there is an increase in industry average revenue (Picture 4).
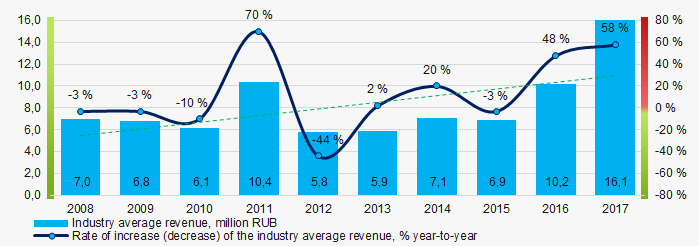 Picture 4. Change in industry average net profit in 2008-2017
Profit and loss
The largest company in term of net profit is LLC AKVA-KAPITAL, INN 7825123775. The company’s profit for 2018 exceeded 7,1 billion RUB.
Over the ten-year period, there is a trend to increase in average net profit (Picture 5).
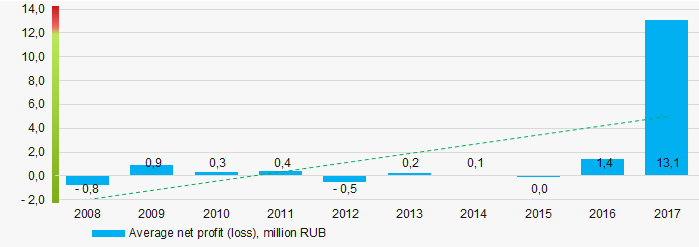 Picture 5. Change in industry average net profit values in 2008-2017
For the five-year period, the average net profit values of TOP-1000 companies increase with the average net loss value also having the increasing trend (Picture 6).
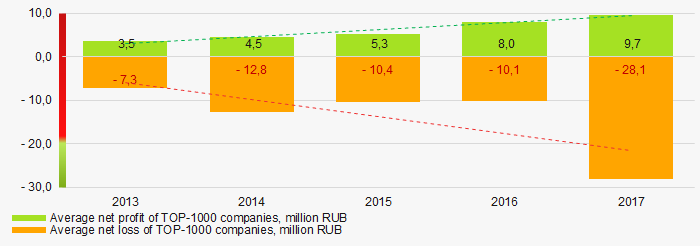 Picture 6. Change in average net profit and net loss of ТОP-1000 in 2015 – 2017
Key financial ratios
For the ten-year period, the average values of the current liquidity ratio were often below the recommended one - from 1,0 to 2,0 with a trend to increase (Picture 7).
Current liquidity ratio (current assets to short-term liabilities) shows the sufficiency of company’s assets to repay on short-term liabilities.
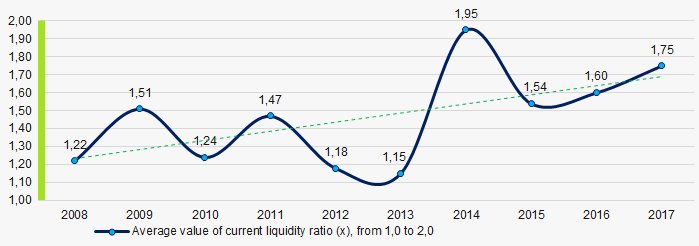 Picture 7. Change in industry average values of current liquidity ratio in 2008 – 2017
For the ten-year period, the average values of ROI ratio were on a quite high level with a trend to increase (Picture 8).
ROI ratio is calculated as net profit to sum of shareholders equity and long-term liabilities, and shows the return of equity involved in commercial activities and long-term borrowed funds.
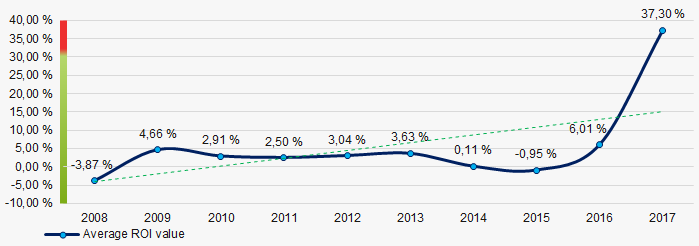 Picture 8. Change in average values of ROI ratio in 2008 – 2017
Assets turnover ratio is the ratio of sales revenue and company’s average total assets for a period. It characterizes the effectiveness of using of all available resources, regardless the source of their attraction. The ratio shows how many times per year the full cycle of production and circulation is performed, generating the corresponding effect in the form of profit.
For the ten-year period, business activity ratio demonstrated the increasing trend (Picture 9).
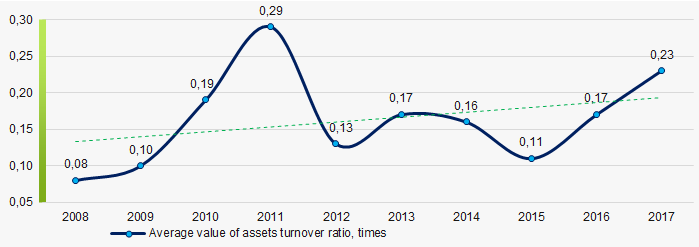 Picture 9. Change in average values of assets turnover ratio in 2008 – 2017
Small enterprises
92% companies of TOP-1000 are registered in the Register of small and medium-sized enterprises of the Federal Tax Service of the Russian Federation. At the same time, their share in total revenue for 2017 amounted to almost 36% that is significantly higher than the national average figure (Picture 10).
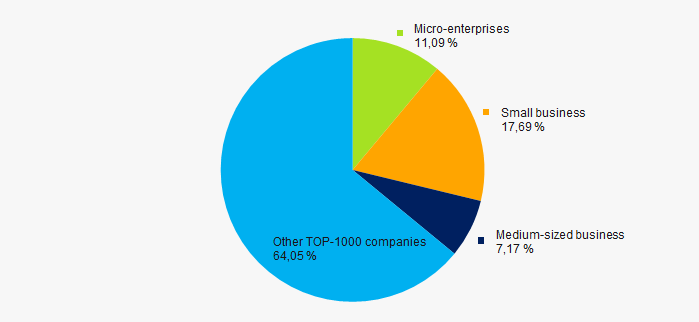 Picture 10. Shares of small and medium-sized enterprises in TOP-100, %
Main regions of activity
Companies of TOP-1000 are registered in 72 regions of Russia and located across the country quite unequally. Over 52% of their turnover is concentrated in Moscow and Saint Petersburg (Picture 11).
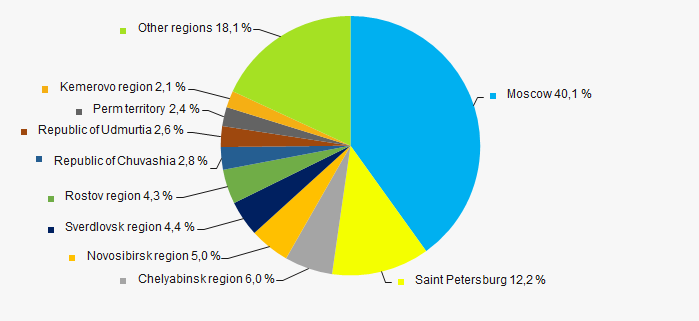 Picture 11. . Distribution of TOP-100 revenue by regions of Russia
Financial position score
Assessment of the financial position of TOP-1000 companies shows that the majority of them have financial position above average (Picture 12).
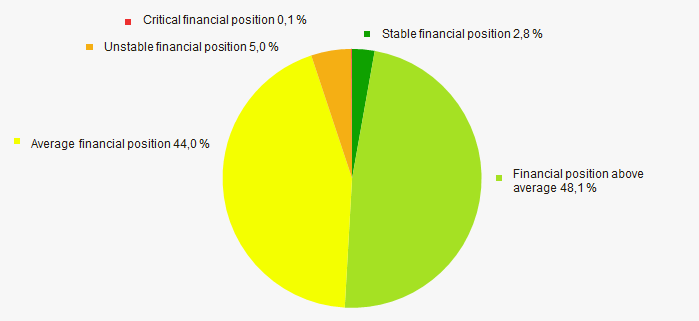 Picture 12. Distribution of TOP-100 companies by financial position score
Solvency index Globas
Most of TOP-1000 companies got Superior / High and Strong / Medium index Globas. This fact shows their ability to meet their obligations fully (Picture 13).
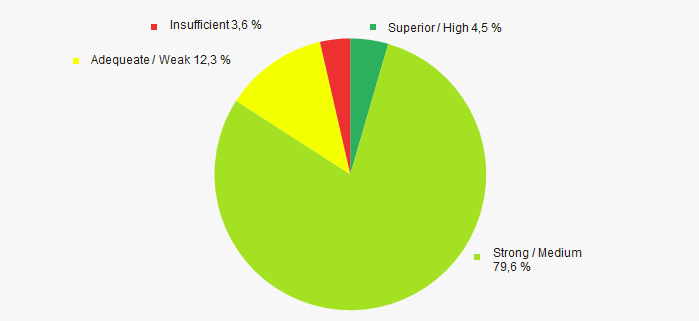 Picture 13. Distribution of TOP-1000 companies by solvency index Globas
Conclusion
Complex assessment of activity of the largest Russian microlending companies, taking into account the main indexes, financial ratios and indicators, demonstrates the prevalence of positive trends (Table 1).
| Trends and evaluation factors | Relative share of factors, % |
| Rate of growth (decline) in the average size of net assets | |
| Increase / decrease in the share of enterprises with negative values of net assets | |
| Rate of growth (decline) in the average size of revenue | |
| Level of competition | |
| Rate of growth (decline) in the average size of profit (loss) | |
| Growth / decline in average values of companies’ net profit | |
| Growth / decline in average values of companies’ net loss | |
| Increase / decrease in average values of total liquidity ratio | |
| Increase / decrease in average values of return on investment ratio | |
| Increase / decrease in average values of asset turnover ratio, times | |
| Share of small and medium-sized businesses in the region in terms of revenue being more than 22% | |
| Regional concentration | |
| Financial position (the largest share) | |
| Solvency index Globas (the largest share) | |
| Average value of relative share of factors | |
![]() positive trend (factor),
positive trend (factor), ![]() negative trend (factor).
negative trend (factor).