Article
The Central Bank of Russia will estimate pledges upon credit activities

In order to improve the bank supervision, protection of creditors and depositors’ interests, to get more reliable information on financial situation of the borrower and item value of the bank pledge, the Federal Law as of 03.07.2016 №362-FZ “On Introducing Amendments to articles 72 and 73 of the Federal Law “On the Central Bank of the Russian Federation (the Bank of Russia)” and article 33 of the Federal Law “On Banks and Banking Activities” was enacted.

The law determines the verification procedure of property availability and estimation by the Central Bank of Russia, being the pledged item upon receipt of a credit. The procedure of familiarization with activities of the borrower and pledger is also determined.

The Central Bank of Russia is entitled a right to carry out an expert examination of the pledged item, accepted as loan collateral, in order to determine the adequacy of credit organization reserves, created for risks. The corresponding examination involves implementation of measures for recognition of the pledged item existence, its inspection and assessment of its value.

Credit organizations are obliged to set up their reserves, taking into account the results of such examination. The ways of assistance with getting information on the pledged item and the borrower’s activity should be described in the internal documents of the credit organizations.

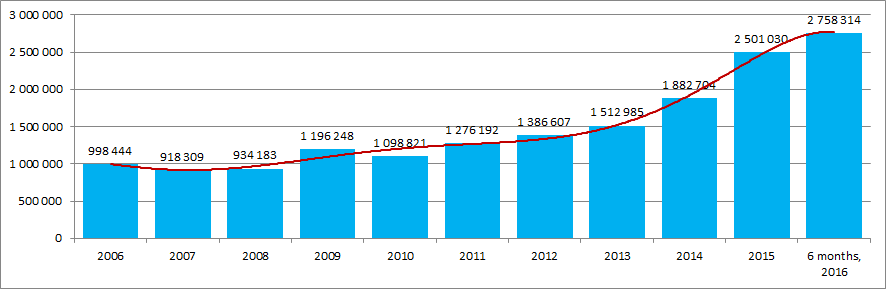
Growing volumes of loan debts of the Russian enterprises in recent years, including debt under bank credits and loan indebtedness, indicate the relevance of the measures taken for increase of pledgers and borrower’s responsibility to the credit organizations (Figure 1).

Figure 1. Average monthly past due total loan debt (loan payable, debt under bank credits, loan indebtedness), (according to the Federal State Statistics Service, million RUB)
Average monthly past due total loan debt (loan payable, debt under bank credits, loan indebtedness), (according to the Federal State Statistics Service, million RUB)

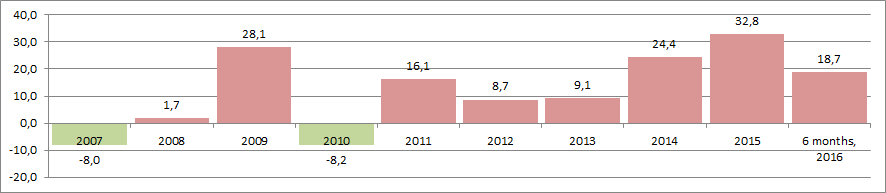
The growth rates of loan debts since 2007 are presented on the Figure 2.

Figure 2. Growth (reduction) of average monthly past due total loan debt (loan payable, debt under bank credits, loan indebtedness), (according to the Federal State Statistics Service, % from year to year)
Growth (reduction) of average monthly past due total loan debt (loan payable, debt under bank credits, loan indebtedness), (according to the Federal State Statistics Service, % from year to year)
Ranking
The largest Russian manufacturers of concrete products by the net profit ratio

Information agency Credinform prepared a ranking of the largest Russian manufacturers of concrete products by the net profit ratio.

Companies with the highest volume of revenue (Top-10) were selected for this ranking according to the data from the Statistical Register for the latest available period (for the year 2014). The enterprises were ranked by the net profit ratio decrease (Table 1).

Net profit ratio (%) is net profit (loss)-to-revenue. This ratio shows the level of the company’s profit from sales.

There is no standard value for this ratio. It is recommended to compare the companies in the industry or the ratio dynamics by the specified company. The negative value indicates the net loss. The higher is the value, the higher is the efficiency of the company.

For the most comprehensive and fair information on the company’s position, it is necessary to take into account not only the values of financial ratios, but also the total of financial and non-financial data.

Table 1. Net profit, revenue, net profit ratio and solvency index Globas-i of the largest Russian manufacturers of concrete products (Top-10)
Name, INN, regionNet profit (loss) 2014, mln RUBTurnover 2014, mln RUBRevenue 2014 to 2013, %Net profit ratio 2013, %Net profit ratio 2014, %Solvency index Globas-i
NPJSC Stroykompleks
INN 3801053916
Irkutsk region
89,0 1 388,0 95 0,75 6,41 199 The highest
NPJSC Voronezh combine of building materials
INN 3665002959
Voronezh region
59,4 1 516,9 100 3,93 3,92 171 The highest
LLC Chelyabinsk plant of concrete products №1
INN 7447188267
Chelyabinsk region
74,9 2 009,0 119 4,25 3,73 199 The highest
LLC Building constructions plant №1
INN 5528211231
Omsk region
9,9 995,3 1 164 2,04 1,00 178 The highest
NPJSC TZHBI-4
INN 6903008805
Tver region
10,0 1 184,6 115 7,17 0,85 187 The highest
LLC DSK GRAD
INN 5032261283
Moscow region
1,1 1 131,1 332 0,24 0,10 260 High
PJSC MOSPROMZHELEZOBETON
INN 7718013513
Moscow
-1,1 1 325,5 70 -1,41 -0,08 218 High
NPJSC 198 Plant of concrete products
ИНН 5028002208
Moscow region
-58,6 2 460,8 94 5,87 -2,38 188 The highest
LLC LSR. Construction-Ural
ИНН 6670345033
Sverdlovsk region
-112,7 3 612,7 87 5,17 -3,12 201 High
LLC ELGAD-ZSI
ИНН 5022047202
Moscow region
-478,6 884,6 130 -39,34 -54,10 257 High

LLC LSR. Construction-Ural, the leader by revenue for 2014, is the next to last in the table. The share of this company in the total volume of the Top-10 companies’ revenue is 22%. In comparison to the previous period, net profit of LLC LSR. Construction-Ural, as well as of other 5 of the Top-10 companies, has reduced. Moreover, the enterprise closed the year of 2014 with the loss, that is why the net profit ratio value is negative.

The highest net profit value of 6,41% belongs to NPJSC Stroykompleks. This company and another three of the Top-10 have reduced their revenue in 2014 compared to 2013.

Only two companies in the top of the ranking have positive dynamics of the net profit ratio value. The average value for the Top-10 for 2014 is negative -4,37% with a trend to reduction compared to the previous year. The value for that period was also negative, but amounted to -1,13%. At the same time, the average value of the Top-10 companies’ net profit ratio for 2014 is positive 1,75%.

All companies have got high and the highest solvency index Globas-i, indicating their ability to timely and fully fulfill the liabilities.

Picture 1. Net profit ratio and revenue of the largest Russian manufacturers of concrete products (Top-10)
Net profit ratio and revenue of the largest Russian manufacturers of concrete products (Top-10)

Total volume of revenue of the Top-10 companies for 2014 amounted to 16,5 mln RUB, that is by 7% higher than in 2013. The growth of revenue of the Top-10 companies for the same period was 13%, however the reduction of net profit by 51% is observed.

At the background of the economic situation in the country, the industry of concrete products manufacturing is in tough situation following the reduction in concrete production according to the results of 2015. This is confirmed by the data of the Federal state statistics service (Table 2) and estimated data based on them (Picture 2).

Table 2. Manufacture of hazardous products in volume terms since 2010 (operative data in accordance with the All-Russian Classifier of the types of economic activity), th CBM
 2010 г.2011 г.2012 г.2013 г.2014 г.2015 г.6 months of 2016
Concrete ready-to-fill (ready-mixed concrete) 19 232,3 24 678,5 27 107,8 28 345,6 30 290,9 25 548,0 11 287,8
Plates, panels and flooring coverings and ceilings of reinforced concrete 5 901,2 7 175,3 8 025,9 8 538,4 9 040,9 7 369,3 2 902,9
Blocks and other prefabricated and reinforced products for buildings and structures made of cement, concrete or artificial stone 683,6 944,3 1 220,2 1 314,9 1 926,1 1 420,4 640,8

Manufacturing by all three types of products reached maximum values in 2014.

Picture 2. Increase (decrease) of manufacturing from year to year, %
Increase (decrease) of manufacturing from year to year, %

Manufacture in 2015 decreased, but according to the results of the first half-year, there are healthy signs of decrease in reduction of blocks manufacturing and even its slight growth.

In the sector of concrete products manufacturing there is no evident concentration of companies in any region of the country. According to the data of the Information and analytical system Globas-i, 100 companies largest in term of revenue for 2014 are registered in 46 regions. Most of them are registered in the following regions (Top-12 of regions):

RegionNumber of enterprises
Moscow region 9
Krasnodar territory 6
Republic of Bashkortostan 5
Republic of Tatarstan 4
Ryazan region 4
Sverdlovsk region 4
Altai territory 3
Moscow 3
Penza region 3
Perm territory 3
Smolensk region 3
Chelyabinsk region 3