Trends in manufacture of refrigerators
Information agency Credinform has prepared a review of trends in manufacture of refrigerators and ventilation equipment.
The largest companies (ТОP-1000) in terms of annual revenue were selected according to the data from the Statistical Register and the Federal Tax Service for the latest available periods (2014 - 2019). The company selection and analysis were based on data of the Information and Analytical system Globas.
Net assets is a ratio reflecting the real value of company's property. It is calculated annually as the difference between assets on the enterprise balance and its debt obligations. The ratio is considered negative (insufficiency of property), if company’s debt exceeds the value of its property.
The largest company in terms of net assets is LLC VEZA, INN 7720040225, Moscow region. In 2019 net assets of the company amounted to almost 5,5 billion RUB.
The smallest size of net assets in TOP-1000 had JSC DZERZHINSKHIMMASH, INN 5249014667, Sverdlovsk region, the legal entity is declared insolvent (bankrupt) and bankruptcy proceedings are initiated, 01.12.2017. The lack of property of the company in 2019 was expressed in negative terms -5,6 billion RUB.
For the last six years, the average industry values of net assets showed the decreasing tendency with negative dynamics of growth rates (Picture 1).
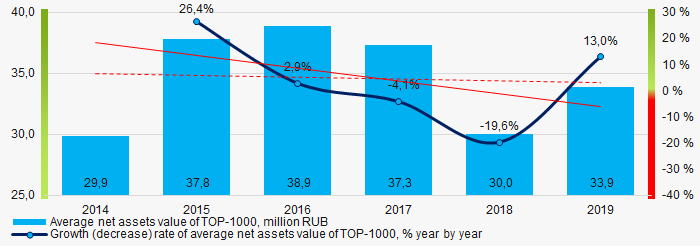 Picture 1. Change in average net assets value in 2014 – 2019
For the last six years, the share of ТОP-1000 enterprises with lack of property had the negative growth trend (Picture 2).
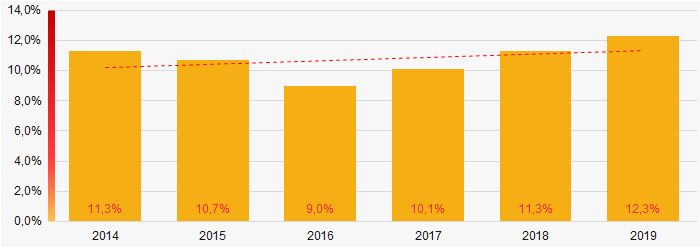 Picture 2. The share of enterprises with negative net assets value in ТОP-1000 in 2014-2019
Sales revenue
In 2019, the total revenue of 10 largest companies amounted to 37% from ТОP-1000 total revenue (Picture 3). This fact testifies the high level of monopolization in the industry.
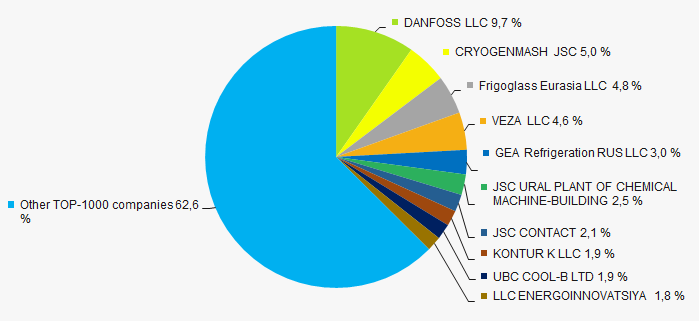 Picture 3. Shares of TOP-10 in TOP-1000 total revenue for 2019
In general, the growing trend in sales revenue with positive dynamics of growth rates is observed (Picture 4).
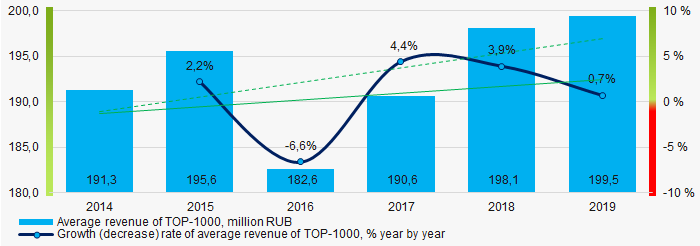 Picture 4. Change in average revenue in 2014 – 2019
 Profit and loss
The largest company in terms of net profit is JSC POLAIR-REAL ESTATE, INN 7703721898, Mari El Republic. In 2019 the company’s profit amounted to more than 1,5 billion RUB.
For the last six years, the average profit values show the growing tendency with the negative dynamics of growth rates (Picture 5).
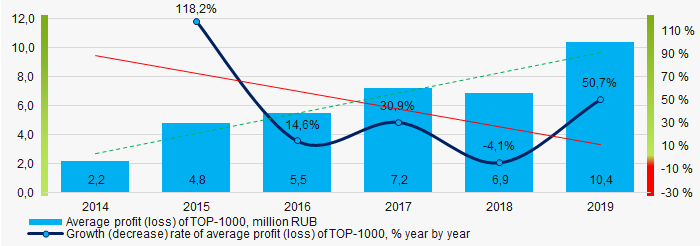 Picture 5. Change in average profit (loss) in 2014 – 2019
Over a six-year period, the average net profit values of ТОP-1000 show the growing tendency, along with this the average net loss is decreasing (Picture 6).
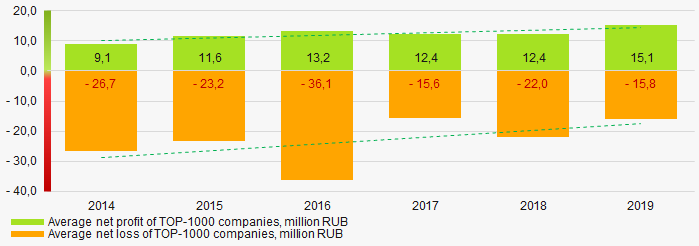 Picture 6. Change in average net profit/loss of ТОP-1000 companies in 2014 – 2019
Main financial ratios
For the last six years, the average values of the current liquidity ratio were higher than recommended values - from 1,0 to 2,0, with growing trend (Picture 7).
The current liquidity ratio (ratio of total working capital to short-term liabilities) shows the sufficiency of company’s assets to meet short-term obligations.
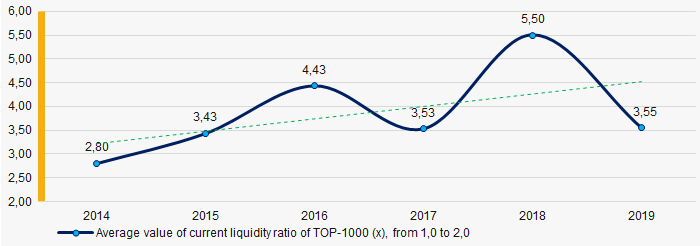 Picture 7. Change in average values of current liquidity ratio in 2014 – 2019
Within six years, the growing trend of the average values of ROI ratio is observed (Picture 8).
The ROI ratio is calculated as a ratio of net profit to sum of stockholder equity and long-term liabilities and shows the return from equity involved in commercial activities and long-term borrowed funds.
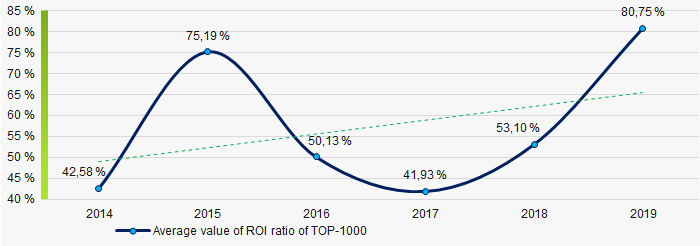 Picture 8. Change in average values of ROI ratio in 2014 – 2019
Assets turnover ratio is the ratio of sales revenue and company’s average total assets for a period. It characterizes the effectiveness of using of all available resources, regardless the source of their attraction. The ratio shows how many times per year the full cycle of production and circulation is performed, generating the corresponding effect in the form of profit.
For the last six years, this business activity ratio demonstrated the decreasing trend (Picture 9).
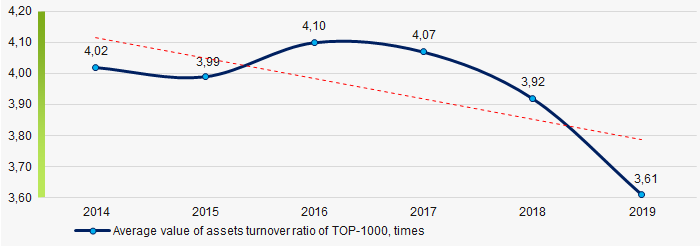 Picture 9. Change in average values of assets turnover ratio in 2014 – 2019
Small businesses
92% of ТОP-1000 companies are registered in the Unified register of small and medium-sized enterprises of the Russian Federal Tax Service. Herein, their share in TOP-1000 total revenue is 38%, which is significantly higher than the national average value in 2018 – 2019 (Picture 10).
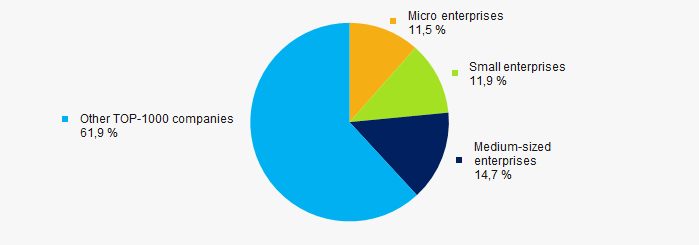 Picture 10. Shares of small and medium-sized enterprises in ТОP-1000
Main regions of activity
TOP-1000 companies are registered in 65 regions of Russia and are unequally located across the country. Almost 49% of the largest enterprises in terms of revenue are located Moscow region and Moscow (Picture 11).
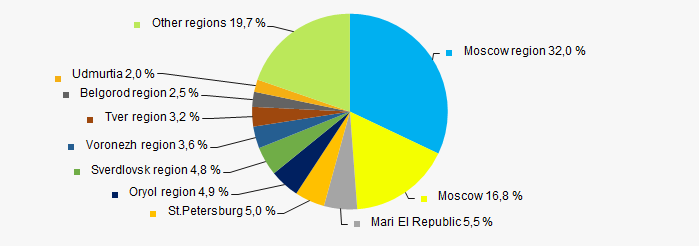 Picture 11. Distribution of TOP-1000 revenue by the regions of Russia
Financial position score
An assessment of the financial position of TOP-1000 companies shows that the largest part have average financial position (Picture 12).
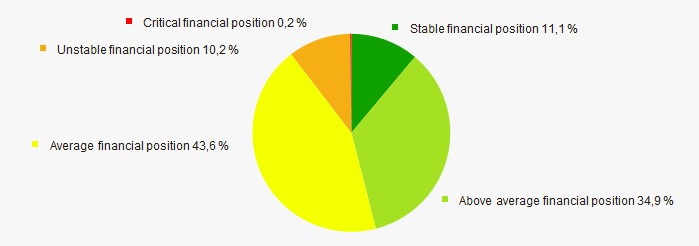 Picture 12. Distribution of TOP-1000 companies by financial position score
Solvency index Globas
Most of TOP-1000 companies got superior/high and strong/medium Solvency index Globas , this fact shows the ability of the companies to meet their obligations in time and fully (Picture 13).
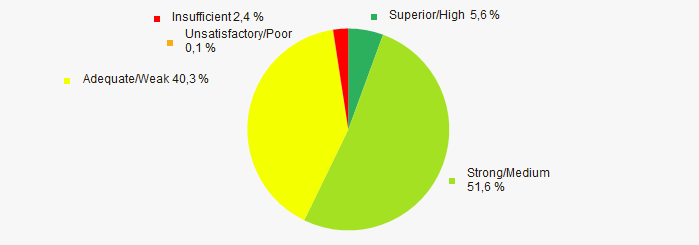 Picture 13. Distribution of TOP-1000 companies by Solvency index Globas
Conclusion
A complex assessment of the manufacturers of refrigerators and ventilation equipment, taking into account the main indexes, financial ratios and indicators, demonstrates the presence of positive trends within 2014-2019 (Table 1).
| Trends and assessment factors | Relative share, % |
| Dynamics of average net assets value |  -10 -10 |
| Growth/drawdown rate of average net assets value |  -10 -10 |
| Increase / decrease in the share of enterprises with negative net assets |  -10 -10 |
| The level of capital concentration |  -10 -10 |
| Dynamics of average net profit |  10 10 |
| Growth/drawdown rate of average revenue |  10 10 |
| Dynamics of average profit (loss) |  10 10 |
| Growth/drawdown rate of average profit (loss) |  -10 -10 |
| Increase / decrease in average net profit of companies |  10 10 |
| Increase / decrease in average net loss of companies |  10 10 |
| Increase / decrease in average values of current liquidity ratio |  5 5 |
| Increase / decrease in average values of ROI ratio |  10 10 |
| Increase / decrease in average values of assets turnover ratio, times |  -10 -10 |
| Share of small and medium-sized businesses by revenue more than 22% |  10 10 |
| Regional concentration |  -10 -10 |
| Financial position (the largest share) |  5 5 |
| Solvency index Globas (the largest share) |  10 10 |
| Average value of factors |  1,2 1,2 |
 favorable trend (factor),
  unfavorable trend (factor)
ТОP-10 of refrigerator manufacturers
Information agency Credinform has prepared a ranking of the largest Russian manufacturers of refrigerators and ventilation equipment. The largest enterprises (TOP-10 and TOP-1000) in terms of annual revenue were selected according to the data from the Statistical Register and the Federal Tax Service for the available periods (2017-2019). Then the companies were ranged by credit period (Table 1). The analysis was based on the data from the Information and Analytical system Globas.
Credit period (days) is calculated as a ratio of average trade payables for a period to sales revenue. The ratio shows for how many days whithin a year the company repaid the average amount of its accounts payable.
The ratio reflects the process of debt repayment to counterparties; it is calculated for the evaluation of cash flows, which allows to draw conclusions on company’s effectiveness and the chosen financial strategy.
The lower the indicator, the faster the company pays the supplier's bills. An increase in turnover may indicate about the problems with bills payment as well as more effective relationships with suppliers, which provide more profitable, deferred payment schedule and use accounts payable as a source of cheap financial resources.
For the most full and fair opinion about the company’s financial position the whole set of financial indicators and ratios should be taken into account.
| Name, INN, region | Revenue, million RUB | Net profit (loss), million RUB | Credit period, days | Solvency index Globas | |||
| 2018 | 2019 | 2018 | 2019 | 2018 | 2019 | ||
| 1 | 2 | 3 | 4 | 5 | 6 | 7 | 8 |
| LLC KONTUR K INN 6952027776 Tver region |
 3 346 3 346 |
 3 831 3 831 |
 387 387 |
 139 139 |
 24,27 24,27 |
 21,02 21,02 |
275 Medium |
| JSC СONTAСT INN 1215013114 Mari El Republic |
 3 563 3 563 |
 4 227 4 227 |
 199 199 |
 415 415 |
 33,36 33,36 |
 29,24 29,24 |
184 High |
| LLC DANFOSS INN 5017050538 Moscow region |
 17 631 17 631 |
 19 433 19 433 |
 466 466 |
 786 786 |
 47,07 47,07 |
 50,30 50,30 |
210 Strong |
| LLC VEZA INN 7720040225 Moscow region |
 7 679 7 679 |
 9 246 9 246 |
 1 043 1 043 |
 1 126 1 126 |
 43,01 43,01 |
 51,72 51,72 |
182 High |
| LLC Frigoglass Eurasia INN 5752019857 Oryol region |
 7 179 7 179 |
 9 546 9 546 |
 717 717 |
 1 206 1 206 |
 70,85 70,85 |
 65,92 65,92 |
218 Strong |
| LLC GEA Grasso Refrigeration INN 7719217750 Moscow |
 3 544 3 544 |
 6 021 6 021 |
 211 211 |
 694 694 |
 135,66 135,66 |
 107,55 107,55 |
215 Strong |
| UBC COOL-B LTD INN 3120083886 Belgorod region |
 4 478 4 478 |
 3 820 3 820 |
 290 290 |
 77 77 |
 87,94 87,94 |
 112,60 112,60 |
239 Strong |
| LLC ENERGOINNOVATSIYA INN 5074048366 Moscow |
 3 095 3 095 |
 3 606 3 606 |
 1 1 |
 2 2 |
 111,26 111,26 |
 119,08 119,08 |
281 Medium |
| CRYOGENMASH JSC INN 5001000066 Moscow region |
 6 182 6 182 |
 9 927 9 927 |
 863 863 |
 -633 -633 |
 253,25 253,25 |
 194,26 194,26 |
293 Medium |
| JSC URAL PLANT OF CHEMICAL MACHINE-BUILDING INN 6664013880 Sverdlovsk region |
 5 787 5 787 |
 5 057 5 057 |
 145 145 |
 36 36 |
 224,20 224,20 |
 230,90 230,90 |
291 Medium |
| Average value for TOP-10 companies |  6 248 6 248 |
 7 471 7 471 |
 432 432 |
 385 385 |
 103,09 103,09 |
 98,26 98,26 |
|
| Average value for TOP-1000 companies |  198 198 |
 200 200 |
 7 7 |
 10 10 |
 299,39 299,39 |
 346,76 346,76 |
|
 growth of indicator in comparison with prior period,
  decline of indicator in comparison with prior period
The average value of credit period for TOP-10 companies is better than ТОP-1000 value. In 2019, five companies improved the result in comparison with prior period.
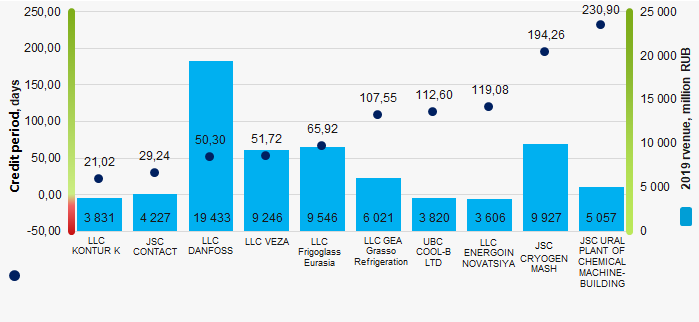 Picture 1. Credit period and revenue of the largest Russian manufacturers of refrigerators and ventilation equipment (ТОP-10)
 Within 6 years, the TOP-1000 average indicators of credit period showed the negative upward trend (Picture 2).
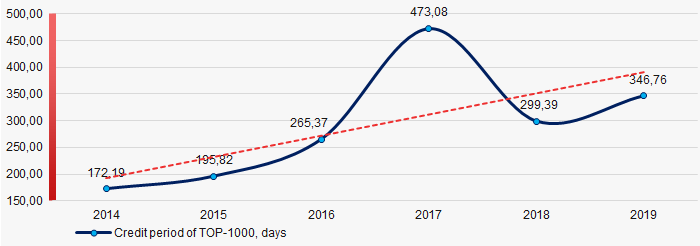 Picture 2. Change in average values of credit period of the largest Russian manufacturers of refrigerators and ventilation equipment in 2014 – 2019