
Order a report
Custom-made industry research, company ratings, competitor analysis


Personal Manager Index (PMI) and Entrepreneur Confidence Index (ECI) confirm the expectations improvement in production industry and in services sector
Purchasing Managers Index (PMI) is one of the most important forward-looking economic indicators. In various economic literature there are different renderings of this index. For instance, it is aggregate subjective macroeconomic measure, or optimism indicator of the top and middle management economic level, or business optimism of business members, or consolidated figures for economic climate, called procurement manager index, or productive-economic indicator of non-state macroeconomic statistics.
Along with this the PMI uniting features are:
- it qualifies the economic climate in productive industry (PMI Manufacturing) and in service sector (PMI Services/PMI non-manufacturing);
- it is calculated and published by different statistics agencies, financial institutions and productive-economic associations;
- survey findings of senior executives, managers are used in bases of calculations;
- it makes possible to study economics’ influence on price assessment;
- it enables to study and to predict the dynamics of economic trends in business, boiling and turning point of business cycle
Due to the fact that the components of the index are new orders, employment, procurement prices and warehouse stocks, the PMI is also used for measurement of changes, forecasting, planning in the field of the new industrial orders, industrial output, employment and operation speed of suppliers.
The principle of making both indices is the same. In the course of polling the managers give the following answers, for example: “the situation worsens” or “the situation improves”. Zero value of the index is adjusted to 50. It means that the index value will amount to 50, if there is an equal number of answers given by the members of the poll. If there are more of those who see the decline, the index value will be lower than 50 and conversely. This index is non-state statistics and is calculated in different countries by different organizations, in the USA – ISM, Europe – Markit Economics, China – HSBC.
Thus according to Markit Economics, there was moderate growth resumption in the Russian service industry in July 2015. It happened due to the fact that the PMI amounted to 51,6 points (see Graph 1) while in June it had 49,5 points. General increase of economic activity in service sector happened on the backdrop of new orders. The growth is marked within four months in succession, what is more the growth rates accelerated to the maximum within the last 20 months.
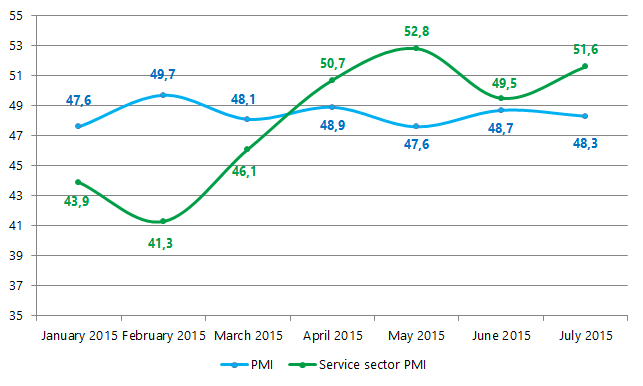
Graph 1. PMI in production industry and service sector in Russia for January-July 2015, points
In the Russian productive industry the general increase of economic activity is conversely being limited. In June 2015 the PMI amounted to 48,7 points, in July to 48,3 points. Insignificant cut-back of new orders, unimplemented production capacities and job cut answer for the reduction of the index. In the meantime in July 2015 the strengthening of new orders general increase to maximum level is marked in private sector since November 2013. However the receipt of new orders was inadequate for the full utilization of production capacities. Job cut also took place in July, but the rates were minimal following the results of the last 9 months.
According to evaluation methods, the figures being lower than «45-50» are the indicators of economic slowdown. However frequently the real situation exerts less influence on the PMI value. There is a belief that indices are more affected by psychological factors. In addition the indices exert the limited effect. The growth of indices value is a favorable factor.
In Russia monthly business activity polls are held by the Federal State Statistics Service (Rosstat). More than 4 hundred enterprises take part in it (except for small companies). The poll findings are expressed in Entrepreneur Confidence Index, ECI. It is calculated in % as an arithmetical average of the balances according to an actual demand, current stock of finished products (reversed in sign) and expected production output. (see Table 1).
| Name | January | February | March | April | May | June | July |
|---|---|---|---|---|---|---|---|
| Manufacturing activities | -9 | -6 | -6 | -5 | -6 | -6 | -6 |
| Extraction of minerals | -7 | -5 | -5 | -5 | -3 | -2 | -2 |
| Production and transmission of electric power, gas and water | -2 | -8 | -11 | -14 | -13 | -10 | -5 |
The analysis of the index shows that a surplus stock of finished goods predominates, owing to the fact that the index value has a minus. Alongside this the ECI has improved by July 2015 in such groups as “Extraction of minerals” and “Production and transmission of electric power, gas and water”.
Study of the business activity in the service sector is also held by the Rosstat and is represented in corresponding ECI (Table 2). Together with this the following values are represented: changes in amount of services rendered, demand for service, services prices (tariff), general economic climate in organization and trends of economic climate changes. Evaluation methods are documented by Rosstat under each indicator.
| Name | 2014 | 2015 | ||||
|---|---|---|---|---|---|---|
| quarters | ||||||
| I | II | III | IV | I | II | |
| Entrepreneur Confidence Index in service sector | -2 | 6 | 2 | -4 | -12 | -1 |
| Measurement of change in amount of service rendered (in monetary terms): - prospective changes | 19 | 13 | 7 | -2 | 10 | 9 |
| - actual changes | -17 | 0 | -1 | -7 | -26 | -6 |
| Measurement of change in demand for service: - prospective changes | 19 | 13 | 6 | -2 | 10 | 8 |
| - actual changes | -18 | 0 | -2 | -7 | -26 | -7 |
| Measurement of change in services prices (tariffs): - prospective changes | 6 | 5 | 2 | 5 | 7 | 6 |
| - actual changes | 2 | 3 | 3 | 1 | 7 | 5 |
| Measurement of the general economic climate in organization | 4 | 6 | 6 | 4 | -10 | -5 |
| Measurement of the economic climate changes trends: - prospective changes | 21 | 16 | 10 | 1 | 9 | 9 |
| - actual changes | -7 | 5 | 3 | -2 | -21 | -3 |
Analysis of the values shows that negative trend of December 2014 has significantly influenced the situation in the first quarter of 2015. However by the end of the second quarter the improvement on a range of indicators is noticeable.
Business activity value by PMI and ECI in Russia in the second quarter of 2015 confirms the expectation trend of the situation improvement in production industry and service sector. It is evident as a hope on demand strengthening, growth of new orders. It will lead to production increase and increase of the works and services amount. In this respect there will be escalation of capacity utilization and necessity for additional human resources. Thus, the expected improvement of the economic climate might generate growth of entrepreneurs’ income. It will be possible to take up the position that the mentioned improvement is a steady trend when these indicators will be analyzed on the long time period in third and fourth quarter of 2015.