
Order a report
Custom-made industry research, company ratings, competitor analysis


Activity trends of information and communication hardware wholesalers
Information Agency Credinform has observed the trends in activity for information and communication hardware wholesalers.
The largest enterprises (TOP-10 and TOP-1000) in terms of annual revenue were selected according to the data from the Statistical Register for the latest available periods (2015 and 2016). The analysis was based on data of the Information and Analytical system Globas.
Net assets
Indicator of real cost of corporate assets, which is annually calculated as the difference between assets of the company and its debt liabilities. Net assets indicator is considered negative (insufficiency of property), if the company’s debts exceed net worth value.
| № in the TOP-1000 list | Name, INN, region | Net assets value, mln RUB* | Solvency index Globas | ||
| 2014 | 2015 | 2016 | |||
| 1 | 2 | 3 | 4 | 5 | 6 |
| 1. | LLC APPLE RUS INN 7707767220 Moscow |
1 428,4 | 9 154,5 | 15 606,6 | 196 High |
| 2. | OCS-CENTER LIMITED INN 7701341820 Moscow |
3 367,0 | 4 707,4 | 5 103,4 | 213 Strong |
| 3. | JSC CROC INCORPORATED INN 7701004101 Moscow |
3 253,8 | 3 285,2 | 3 367,7 | 188 High |
| 4. | COMPLETE COMPANY, LTD INN 7810793872 Saint-Petersburg |
1 206,8 | 2 349,3 | 2 556,4 | 175 High |
| 5. | JSC JET INFOSYSTEMS INN 7729058675 Moscow |
541,9 | 1 084,3 | 2 286,9 | 162 Superior |
| 996. | LLC D-LINK TRADE INN 6229040685 Ryazan region |
12,1 | -225,5 | -61,5 | 298 Medium |
| 997. | Technologies, systems and complexes Limited INN 7701922888 Moscow |
-101,0 | -100,9 | -61,7 | 302 Adequate |
| 998. | LLC KORDEIL INN 7811533531 Saint-Petersburg |
1,4 | -87,5 | -62,4 | 302 Adequate |
| 999. | JSC R-STYLE INN 7715037964 Moscow |
110,3 | 126,3 | -104,6 | 342 Adequate |
| 1000. | MARVEL COMPANY LIMITED INN 7811070820 Moscow |
315,2 | 324,6 | -757,1 | 600 Insufficient (Process of being wound up, 01.06.2017) |
*) – growth/decline indicators compared to previous period are marked with green and red filling in columns 4 and 5 respectively.
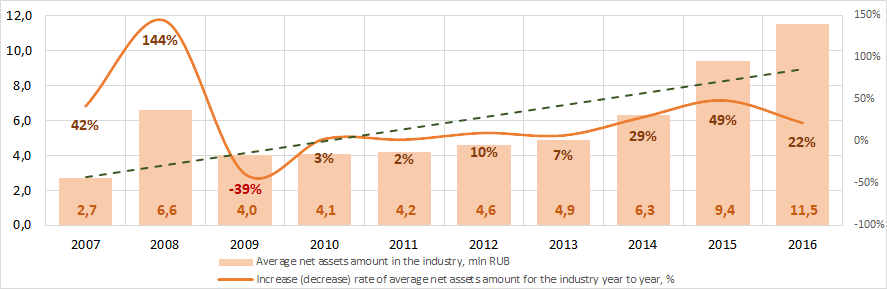 Picture 1. Change in average net assets value of information and communication hardware wholesalers in 2007 – 2016
Sales revenue
In 2016 total revenue of 10 leaders of the industry amounted to 54% from TOP-1000 total revenue. This fact shows relatively low level of competition among the industry (Picture 2).
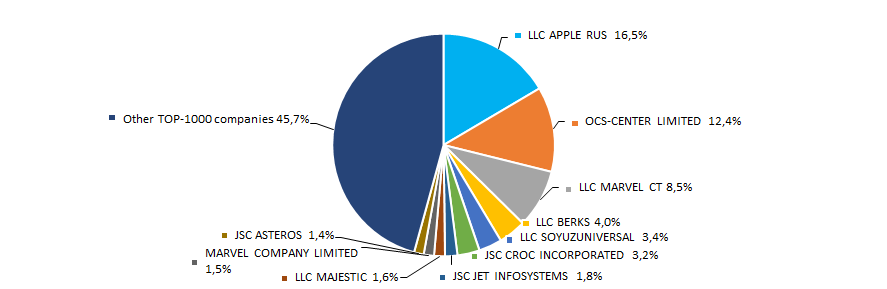 Picture 2. Shares of TOP-10 companies in TOP-1000 total revenue for 2016
In general, the increasing tendency in sales revenue is observed (Picture 3).
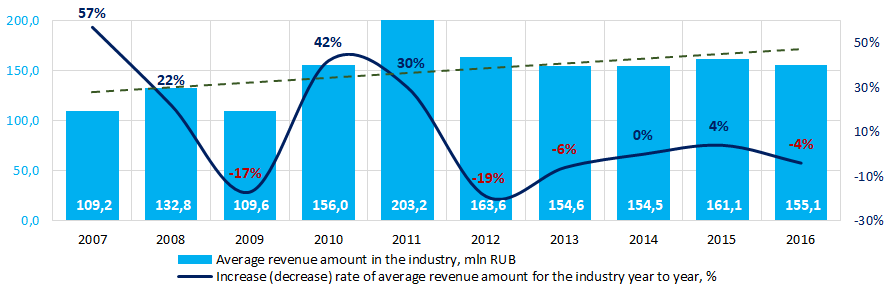 Picture 3. Change in average revenue of information and communication hardware wholesalers in 2007 – 2016
Profit and loss
Profit of 10 leading companies in the industry was 70% from TOP-1000 total profit in 2016 (Picture 4).
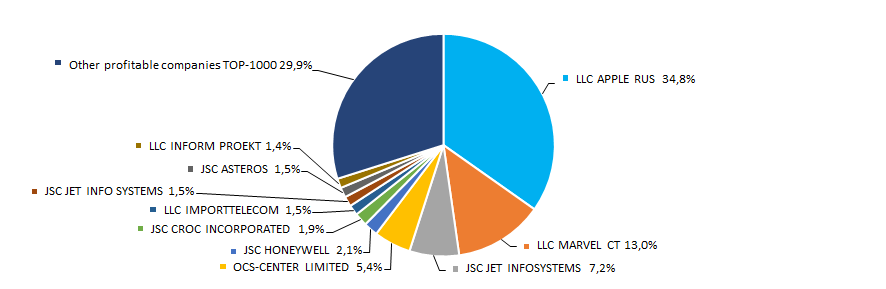 Picture 4. Shares of TOP-10 companies in TOP-1000 total profit for 2016
For the ten-year period, the average industrial profit values have increasing tendency (Picture 5).
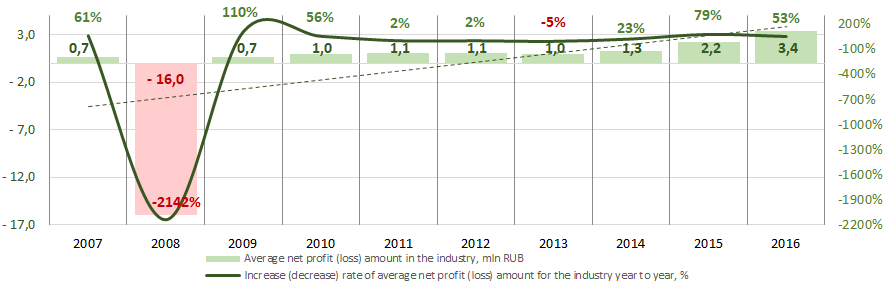 Picture 5. Change in average industrial profit values of the information and communication hardware wholesalers in 2007 – 2016
For the three-year period, the average profit indicators of TOP-1000 companies show the growing tendency and the average net loss decreases (Picture 6).
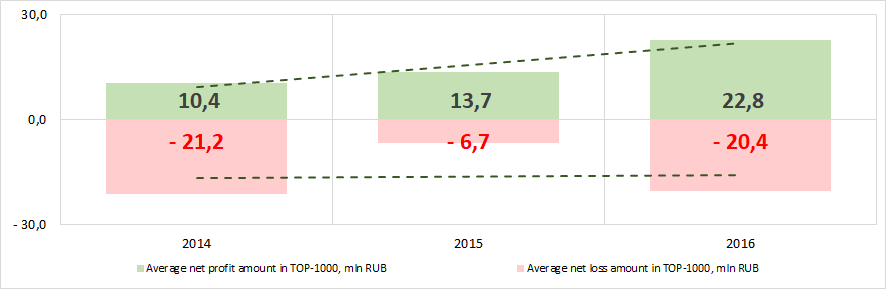 Picture 6. Change in average profit/loss of the information and communication hardware wholesalers in 2007 – 2016
Key financial ratios
For ten years average indicators of the current liquidity ratio in the industry were within the interval of the recommended values – from 1,0 to 2,0 (Picture 7). In general, indicator of the ratio has increasing tendency.
Current liquidity ratio (the relation of the amount of current assets to short-term liabilities) shows the sufficiency of company’s funds for repayment of its short-term liabilities.
The experts of Information Agency Credinform, having taken into account the current situation in the economy as a whole and in the industries, has been developed and implemented in the Information and Analytical system Globas a calculation of practical values of financial ratios, which might be considered as normal for a certain industry. For the information and communication hardware wholesalers practical value of the current liquidity ratio was from 1,02 to 3,00 in 2016.
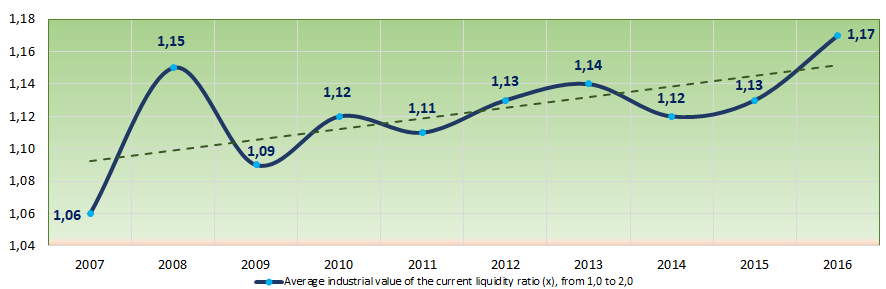 Picture 7. Change in average industrial values of current liquidity ratio of the information and communication hardware wholesalers in 2007 – 2016
For the eight-year period, the instability of indicators of the return on investments ratio with increasing tendency is observed (Picture 8). The return on investments ratio ratio is calculated as a ratio of net profit to sum of equity and long-term liabilities and shows the return from equity involved in commercial activities and long-term borrowed funds.
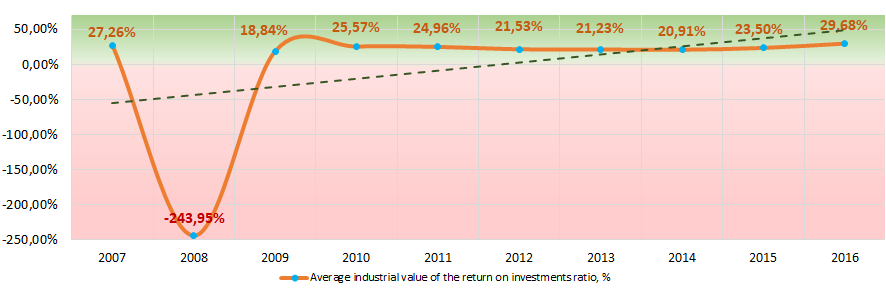 Picture 8. Change in average industrial values of the return on investments ratio of the information and communication hardware wholesalers in 2007 – 2016
Assets turnover ratio is the ratio of sales revenue and company’s average total assets for a period and characterizes the effectiveness of using of all available resources, regardless the source of their attraction. The ratio shows how many times per year the full cycle of production and circulation, generating profit, is performed.
For the ten-year period, this business activity ratio demonstrated, in general, the decreasing trend (Picture 9).
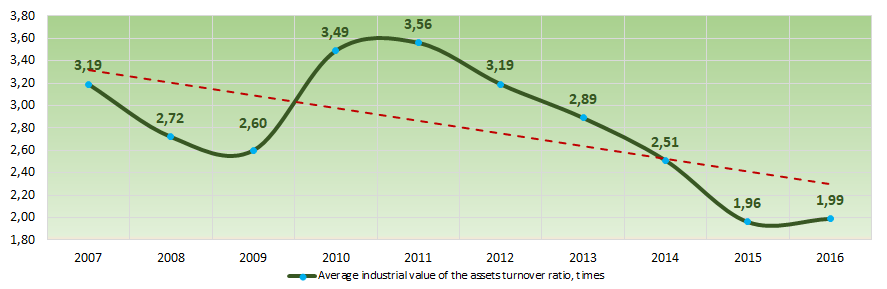 Picture 9. Change in average industrial values of the assets turnover ratio of the information and communication hardware wholesalers in 2007 – 2016
Production and services structure
The largest share in TOP-1000 total revenue take companies engaged in wholesale of computers, peripheral devices and software (Picture 10).
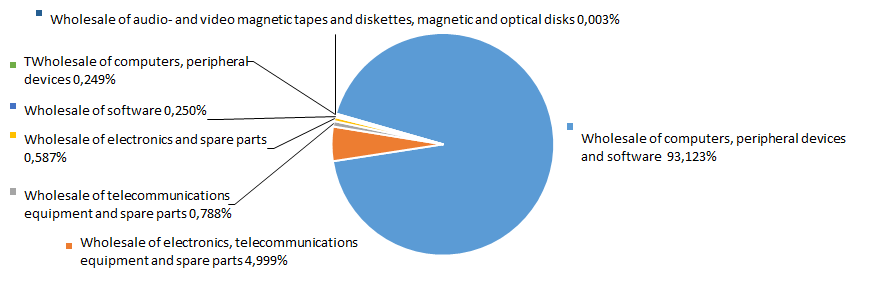 Picture 10. Distribution of activity types in TOP-1000 total revenue, %
Main regions of activity
Companies TOP-1000 are distributed unequally on the territory of the country and registered in 64 regions (Picture 11).
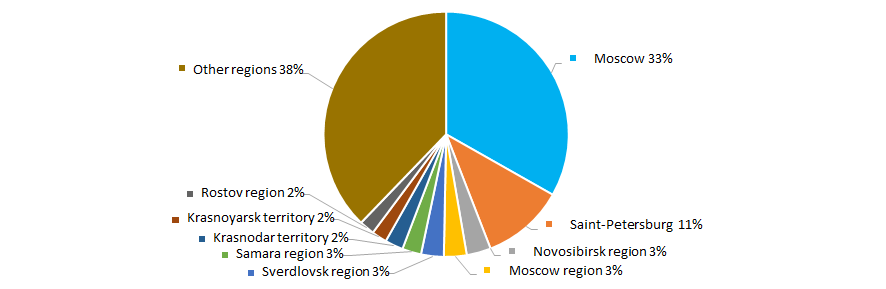 Picture 11. Distribution of TOP-1000 companies throughout regions of Russia
Financial position score
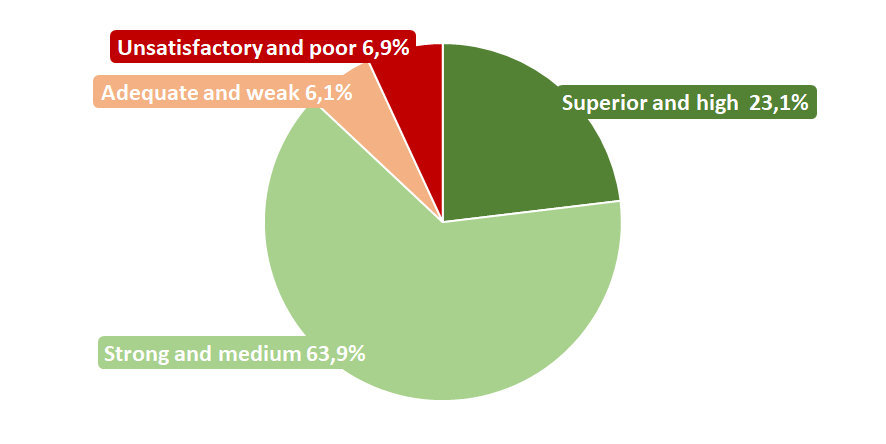
The assessment of TOP-1000 financial position shows that major part has stable or above average financial position (Picture 12).
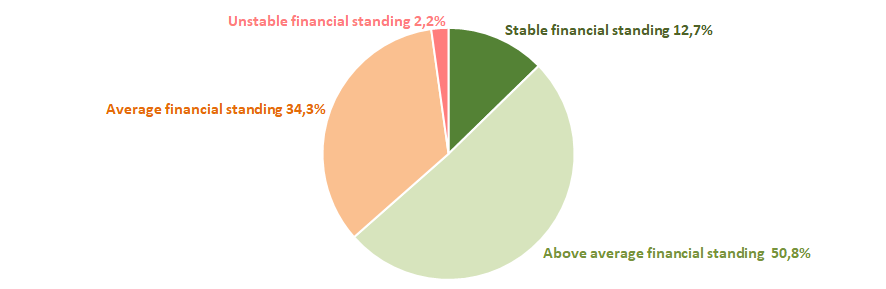 Picture 12. Distribution of TOP-1000 companies by financial position score
Solvency index Globas
The majority of TOP-1000 companies have got from superior to medium solvency index Globas, this fact shows the ability of the companies to pay their debts in time and fully (Picture 13).
 Picture 13. Distribution of TOP-1000 companies by solvency index Globas
Therefore, the complex assessment of the information and communication hardware wholesalers, taking into account main indexes, financial indicators and ratios, demonstrates the domination of favorable trends in the industry.