
Order a report
Custom-made industry research, company ratings, competitor analysis


Record low of shell companies in EGRUL
According to the Federal Tax Service of Russia (FTS), 3,72 million of active legal entities amounted in Russia on January 1, 2020. Since 2016 speedy reduction of that amount has been noticed. Is it crisis of the Russian economy or result of actions against shady business? What measures are taken by the FTS for clearing business environment from unreliable companies? Let us view statistic data and make intermediate conclusion, since combating shell companies has not finished.
Amount of active companies in Russia reached a climax in 2016. Heavily decreasing, the amount of legal entities has been reduced on 22,8% to 2020 (s. Picture 1). After viewing dynamics of changing of amount of companies, it may be assumed that unfavorable economic environment appeared in Russia. Is it true?
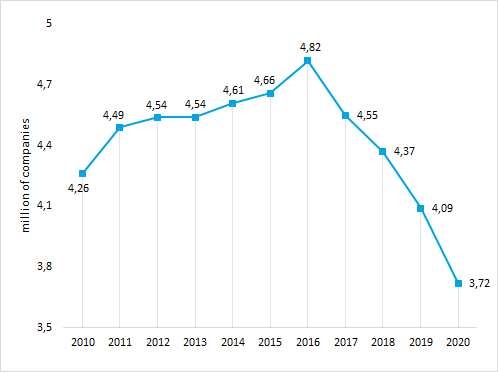 Picture 1. Amount of active legal entities in EGRUL
Combating shell companies
Crisis is characterized by growth of bankruptcy amount. However, liquidations for that reason do not exceed 9 thousands to 2020, that is 1,3% of the total amount of companies ceased operations (s. Picture 2).
For many years the main reason for liquidation remains decisions of a tax service. In 2019 amount of companies, removed from the EGRUL marked with «by decision of the FTS», was 85% from total liquidated companies.
In 2016 the FTS was authorized to identify companies with signs of unreliability and compulsorily strike them off. As a result, EGRUL clears of shady companies.
According to the Information and Analytical system Globas, over 5 years amount of shell companies has been decreased from 30% to 2%. Currently, about 76 thousand organizations have notable negative signs typical for shell companies. The amount of such companies has been twice reduced, compared to the previous period. Besides, evidence of unreliability can be found in more than 370 thousand companies. Unreliable companies can be identified with the help of «Signs of a shell company» module – one of the main indexes Globas. Index not only finds shell companies, but also unreliable legal entities, downplaying VAT amount; debtors on obligatory payments and companies not presenting financial accounts to the tax authorities.
Combating alternate liquidations
Since 2016, simultaneously with reduction of shell companies, the amount of companies in reorganization is 6,5 times decreasing (s. Picture 2). Now the beginning of such procedure is the reason for strict inspection from the FTS regarding tax payment and reliable data. In this case, the amount of shell companies has also decreased via merging or acquisition processes, often used by alternate liquidations.
Besides, amount of voluntarily liquidations increased on 19% to 74 thousand in 2020 (s. Picture 2). Entrepreneurs prefer going through legal cessation procedure. Earlier, businessmen, without regard to reputation, just left companies with debts or unreliable data and founded new ones. Nowadays, such individuals are deprived from manage and establish new companies during 3 years.
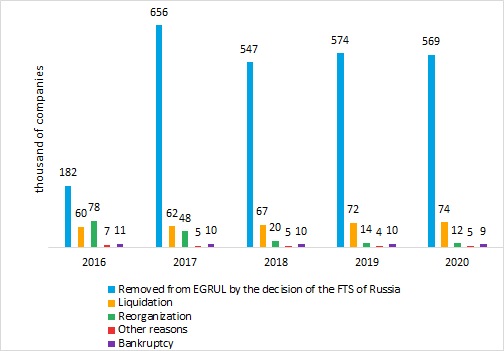 Picture 2. Reasons for cessation of legal entities
Summaries
Decrease in amount of companies in the EGRUL is consequence of combating of the FTS against unreliable companies. Crisis developments is not confirmed by the statistical data on liquidations.
For the last 5 years tax authorities are combating shadow economy sector. After investigating of statistical data, it can be affirmed that the authorities have in fact achieved significant results in clearing business, and taken measures promote to it.
Strengthening of control for shady companies from the FTS has bottom side: growth of pressure on reliable entrepreneurs, complication of tax and financial accounting, high chance of undue categorizing of small businesses and newly-established companies as unreliable.
As known, shadow market is adjusted to familiar reliability criteria: long registered companies with account activities are chosen for shady operations, on the web-sites of famous recruitment agencies job advertisements are posted for demonstration of false activities, pseudo-web-sites are set up.
That is why investigation of contractors was and still remains difficult task of security services of companies that requires best tools for immediate and reliable investigation and analysis of business environment.
Information and Analytical system Globas has all the necessary resources for that purpose: Indexes, customized Checklist, Monitoring, Lists analysis, Links, Report under FTS and other sections and functions that help experts to make analysis of business-partners fast and effectively.