
Order a report
Custom-made industry research, company ratings, competitor analysis


Trends in jewellery industry
Information agency Credinform has prepared a review of trends in activity of Russian jewellery companies.
The largest companies engaged in manufacture, sale and repair of products made of precious metals and stones (ТОP-1000) in terms of annual revenue were selected according to the data from the Statistical Register and the Federal Tax Service for the latest available periods (2016 - 2020). The company selection and analysis were based on data of the Information and Analytical system Globas.
Net assets is a ratio reflecting the real value of company's property. It is calculated annually as the difference between assets on the enterprise balance and its debt obligations. The ratio is considered negative (insufficiency of property), if company’s debt exceeds the value of its property.
The largest company in terms of net assets is STATE UNITARY ENTERPRISE THE COMMETTEE FOR PRECIOUS METALS AND GEM STONES OF THE REPUBLIC SAKHA (YAKUTIA), INN 1435343333, the Republic of Sakha (Yakutia), retail sale of jewellery in specialized stores. In 2020 net assets of the company amounted to more than 9,4 billion RUB.
The smallest size of net assets in TOP-1000 had LLC STOLICHNYI YUVELIRNYI ZAVOD, INN 7715602359, Moscow, manufacture of jewellery, medals from precious metals and stones, the legal entity is declared insolvent (bankrupt) and bankruptcy proceedings are initiated, 27/01/2021. The lack of property of the company in 2020 was expressed in negative terms -34,3 billion RUB.
For the last five years, the average industry values of net assets showed the downward tendency with decreasing dynamics of growth rates (Picture 1).
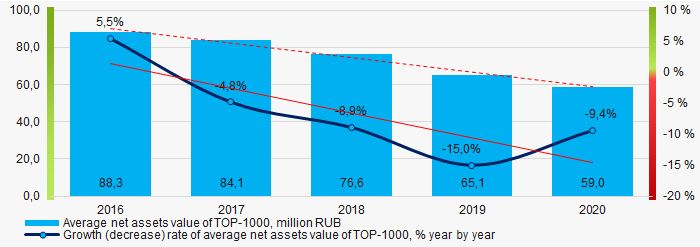 Picture 1. Change in average net assets value in 2016 – 2020
For the last five years, the share of ТОP-1000 enterprises with lack of property had the positive decreasing trend (Picture 2).
 Picture 2. The share of enterprises with negative net assets value in ТОP-1000 in 2016-2020
Sales revenue
In 2020, the total revenue of 10 largest companies amounted to 52% from ТОP-1000 total revenue (Picture 3). This fact testifies the high level of capital concentration in the jewellery industry.
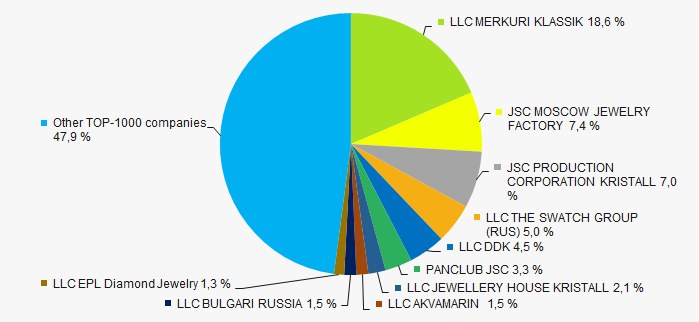 Picture 3. Shares of TOP-10 in TOP-1000 total revenue for 2020
In general, the decreasing trend in sales revenue with downward dynamics of growth rates is observed (Picture 4).
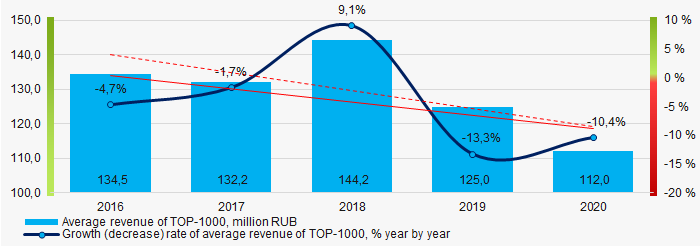 Picture 4. Change in average revenue in 2016 – 2020
 Profit and loss
The largest company in terms of net profit is MOSCOW JEWELRY FACTORY, INN 7724181241, Moscow, manufacture of jewellery, medals from precious metals and stones. In 2020 the company’s profit amounted to almost 2,3 billion RUB.
For the last five years, the average profit values show the decreasing tendency (Picture 5).
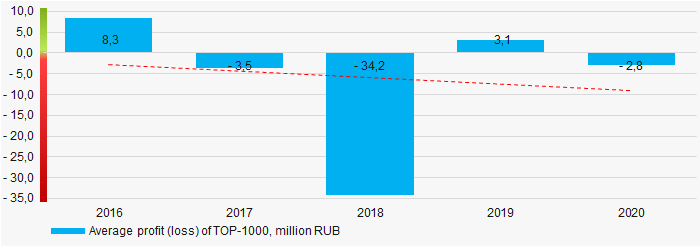 Picture 5. Change in average profit (loss) in 2016 – 2020
Over a five-year period, the average net profit values of ТОP-1000 show the growing tendency, along with this the average net loss is increasing (Picture 6).
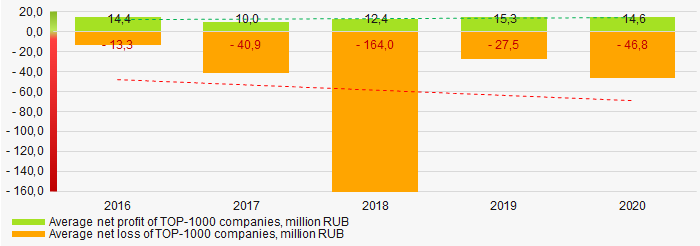 Picture 6. Change in average net profit/loss of ТОP-1000 companies in 2016 – 2020
Main financial ratios
For the last five years, the average values of the current liquidity ratio were higher than the recommended values - from 1,0 to 2,0, with growing trend (Picture 7).
The current liquidity ratio (ratio of total working capital to short-term liabilities) shows the sufficiency of company’s assets to meet short-term obligations.
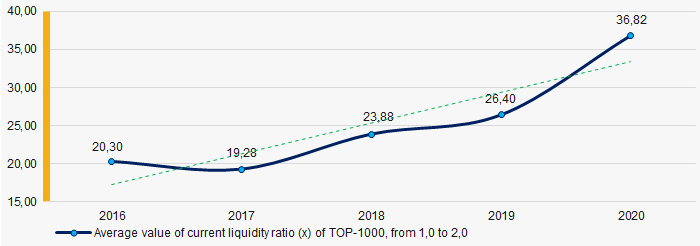 Picture 7. Change in average values of current liquidity ratio in 2016- 2020
Within five years, the decreasing trend of the average values of ROI ratio is observed (Picture 8).
The ROI ratio is calculated as a ratio of net profit to sum of stockholder equity and long-term liabilities and shows the return from equity involved in commercial activities and long-term borrowed funds.
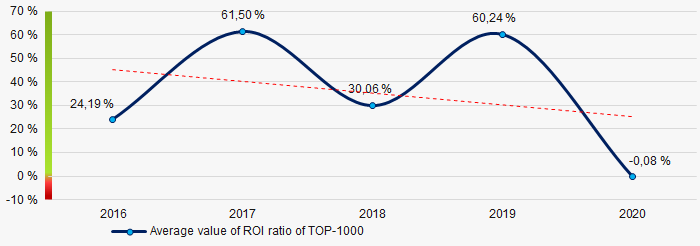 Picture 8. Change in average values of ROI ratio in 2016 – 2020
Assets turnover ratio is the ratio of sales revenue and company’s average total assets for a period. It characterizes the effectiveness of using of all available resources, regardless the source of their attraction. The ratio shows how many times per year the full cycle of production and circulation is performed, generating the corresponding effect in the form of profit.
For the last five years, this business activity ratio demonstrated the decreasing trend (Picture 9).
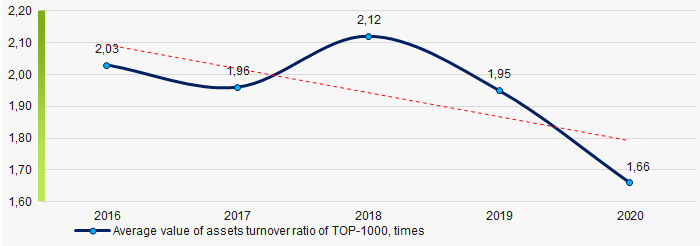 Picture 9. Change in average values of assets turnover ratio in 2016 – 2020
Small businesses
96% of ТОP-1000 companies are registered in the Unified register of small and medium-sized enterprises of the Russian Federal Tax Service. Herein, their share in TOP-1000 total revenue is almost 42%, which is twice higher than the national average value in 2018 – 2019 (Picture 10).
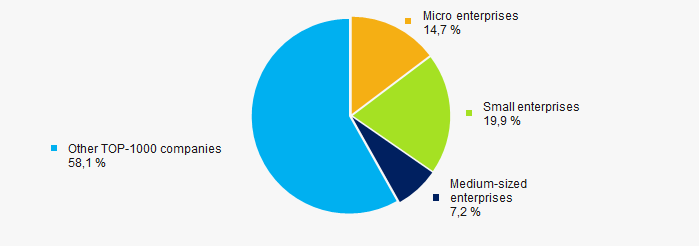 Picture 10. Shares of small and medium-sized enterprises in ТОP-1000
Main regions of activity
TOP-1000 companies are registered in 70 regions of Russia and are unequally located across the country. Almost 47% of the largest enterprises in terms of revenue are located Moscow (Picture 11).
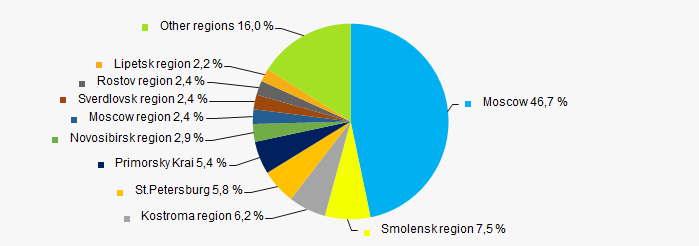 Picture 11. Distribution of TOP-1000 revenue by the regions of Russia
Financial position score
An assessment of the financial position of TOP-1000 companies shows that the largest part has the average financial position (Picture 12).
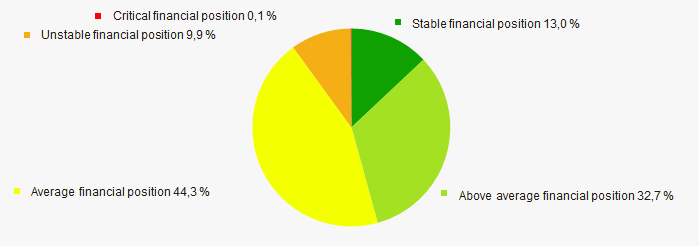 Picture 12. Distribution of TOP-1000 companies by financial position score
Solvency index Globas
Most of TOP-1000 companies got superior/high and strong/medium Solvency index Globas, this fact shows the ability of the companies to meet their obligations in time and fully (Picture 13).
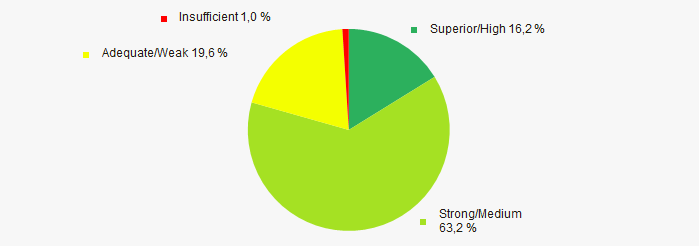 Picture 13. Distribution of TOP-1000 companies by Solvency index Globas
Conclusion
A complex assessment of the largest jewellery companies, taking into account the main indexes, financial ratios and indicators, demonstrates the presence of negative trends within 2016-2020 (Table 1).
| Trends and assessment factors | Relative share, % |
| Dynamics of average net assets value | |
| Growth/drawdown rate of average net assets value | |
| Increase / decrease in the share of enterprises with negative net assets | |
| The level of capital concentration | |
| Dynamics of average revenue | |
| Growth/drawdown rate of average revenue | |
| Dynamics of average profit (loss) | |
| Increase / decrease in average net profit of companies | |
| Increase / decrease in average net loss of companies | |
| Increase / decrease in average values of current liquidity ratio | |
| Increase / decrease in average values of ROI ratio | |
| Increase / decrease in average values of assets turnover ratio, times | |
| Share of small and medium-sized businesses by revenue more than 20% | |
| Regional concentration | |
| Financial position (the largest share) | |
| Solvency index Globas (the largest share) | |
| Average value of factors | |
![]() favorable trend (factor),
favorable trend (factor), ![]() unfavorable trend (factor)
unfavorable trend (factor)