Economy in Samara in crisis years
The impacts of the previous 2008 - 2009 global financial crisis were overcome only by 2011. By that moment more than 26 thousand companies had been operating in Samara.
Information agency Credinform represents a review of the activity trends of the largest companies of the real economy in Samara during the financial crisis of 2008 – 2009 years.
ДThe largest enterprises in Samara (TOP-1000) in terms of annual revenue were selected for the analysis according to the data from the Statistical Register for the period of 2006 – 2011 years. The analysis was based on the data from the Information and Analytical system Globas.
Number of active companies
From 2006 to 2011, the number of active companies increased, but the growth rates decreased especially during the acute phase of the crisis and the period of recovery.
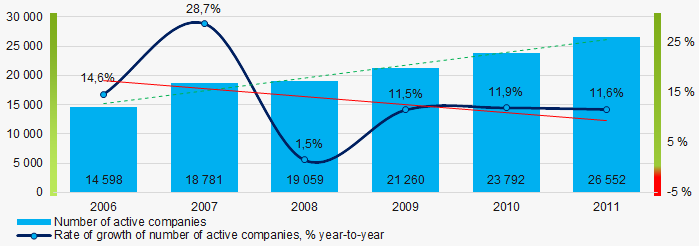 Picture 1. Change in the number of active companies in 2006 – 2011
Net assets are total assets less total liabilities. This indicator reflects the real value of the property of an enterprise. When the company’s debt exceeds the value of its property, the indicator is considered negative (insufficiency of property).
The largest company of the real sector of economy in Samara in term of net assets was AO TRANSNEFT-PRIVOLGA, INN 6317024749. In 2011, net assets value of the company amounted to more than 90 billion RUB, in 2019 – to almost 201 billion RUB.
The lowest net assets value among TOP-1000 was recorded for JSC "VOLZHSKI OIL SHIPPING COMPANY "VOLGOTANKER", INN 6317019185, in process of being wound up since 17.03.2008. In 2011, insufficiency of property of the company was indicated in negative value of -3,2 billion RUB, and in 2019 the figure amounted to -1,2 billion RUB.
In 2006 - 2011, the average net assets values of TOP-1000 had a general trend to increase, however the growth rates were decreasing especially during the acute phase of the crisis and the period of recovery. (Picture 2).
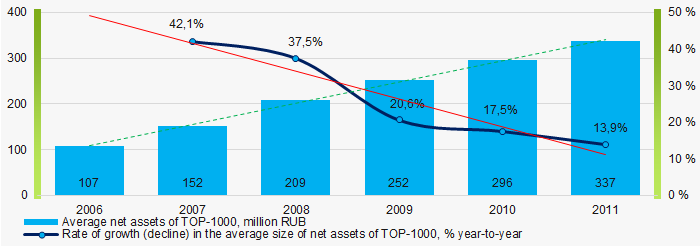 Picture 2. Change in average net assets value in TOP-1000 in 2006 – 2011
In general, the shares of TOP-1000 companies with insufficient property had a trend to decrease in 2006-2011(Picture 3).
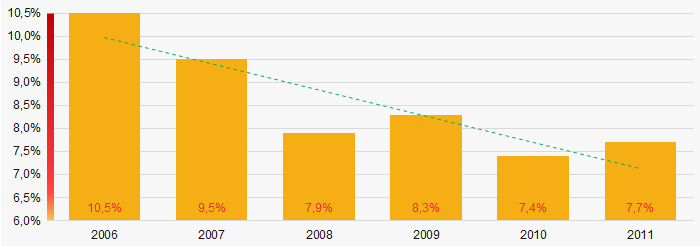 Picture 3. Shares of companies with negative net assets value in TOP-1000 in 2006 – 2011
Sales revenue
The largest company of the real sector of economy in Samara by revenue was JSC SAMARANEFTEGAS, INN 6315229162. The revenue volume amounted to 99 billion RUB in 2011, and rolled over to 255 billion RUB in 2019.
In general, there was a trend to increase in revenue with decreasing growth rate during the acute phase of the crisis (Picture 4).
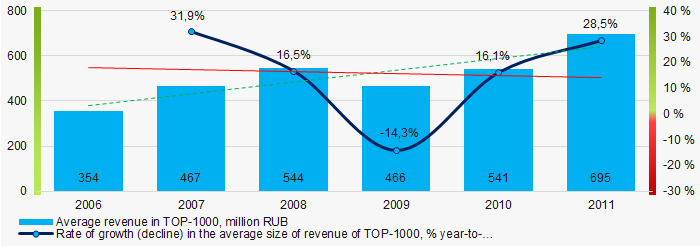 Picture 4. Change in average revenue in TOP-1000 in 2006 – 2011
Profit and loss
The largest company of the real sector of economy in Samara in term of net profit was as well JSC SAMARANEFTEGAS, INN 6315229162. The company’s profit amounted to 30 billion RUB in 2011, and it increased to 53 billion RUB in 2019.
During the period of 2006 – 2011, the average profit figures of TOP-1000 companies had a general trend to increase with decreasing growth rate especially during the acute phase of the crisis (Picture 5).
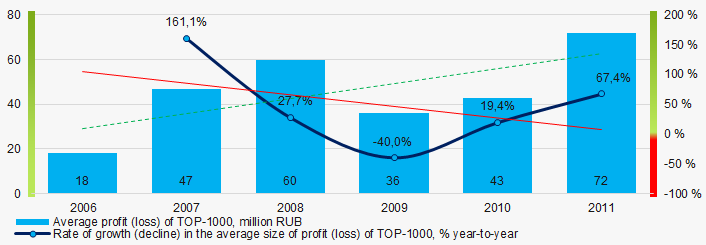 Picture 5. Change in average profit (loss) in TOP-1000 in 2006- 2011
In 2006 – 2011, the average net profit figures of TOP-1000 companies had a general trend to increase, while the average net loss decreased (Picture 6).
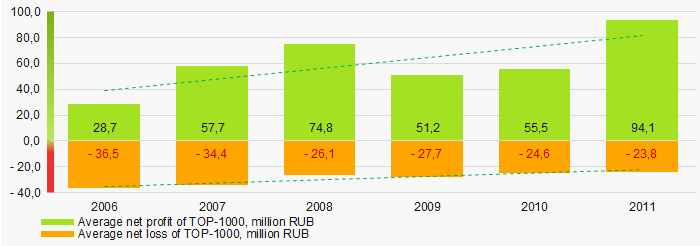 Picture 6. Change in average net profit and net loss in ТОP-1000 in 2006 – 2011
Key financial ratios
In 2006 – 2011, the average values of the current liquidity ratio of TOP-1000 were above the recommended one – from 1,0 to 2,0, with a trend to increase. (Picture 7).
Current liquidity ratio (current assets to short-term liabilities) shows the sufficiency of company’s assets to repay on short-term liabilities.
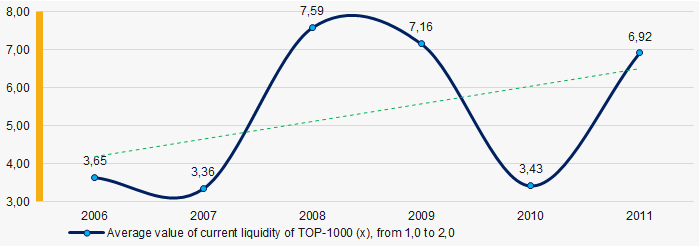 Picture 7. Change in average values of current liquidity ratio in TOP-1000 in 2006 – 2011
At the period of 2006 – 2011, there was a general trend to decrease in the averageROI values (Picture 8).
ROI ratio is calculated as net profit to sum of shareholders equity and long-term liabilities, and shows the return of equity involved in commercial activities and long-term borrowed funds.
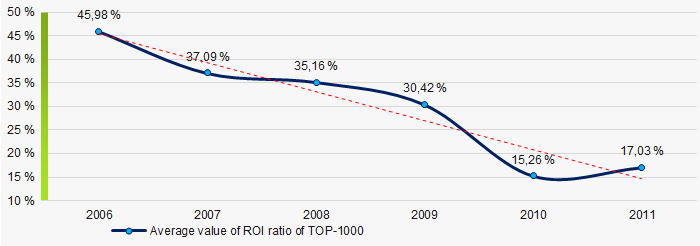 Picture 8. Change in average values of ROI ratio in TOP-1000 in 2006 – 2011
Assets turnover ratio is the ratio of sales revenue and company’s average total assets for a period. It characterizes the effectiveness of using of all available resources, regardless the source of their attraction. The ratio shows how many times per year the full cycle of production and circulation is performed, generating the corresponding effect in the form of profit.
In 2006 – 2011, there was a trend to decrease of this ratio, especially during the acute phase of the crisis and the period of recovery. (Picture 9).
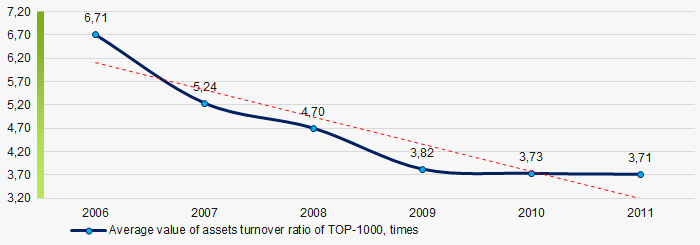 Picture 9. Change in average values of assets turnover ratio in TOP-1000 in 2006 – 2011
Small enterprises
56% companies of TOP-1000 are registered in the Register of small and medium-sized enterprises of the Federal Tax Service of the Russian Federation. However, their share in total revenue of TOP-1000 amounted 13% in 2011 (Picture 10).
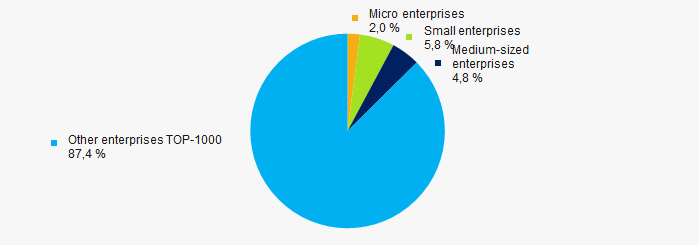 Picture 10. Shares of revenue of small and medium-sized enterprises in TOP-1000 in 2011
Financial position score
According to the assessment, the financial position of most of TOP-1000 companies is average in 2020. At the same time, index wasn’t assigned to 1/3 enterprises, which indicates the fact that these companies doesn’t have financial accounts. (Picture 11).
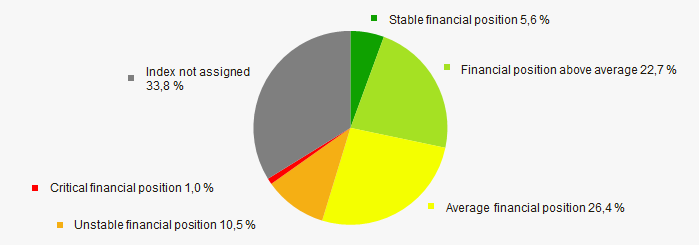 Picture 11. Distribution of TOP-1000 companies by financial position score in 2020
Solvency index Globas
In 2020, almost the half of TOP-1000 companies got Superior / High and Strong / Medium index Globas. This fact shows their ability to meet their obligations fully and by the due date (Picture 12). However, more than one third of enterprises have Insufficient value.
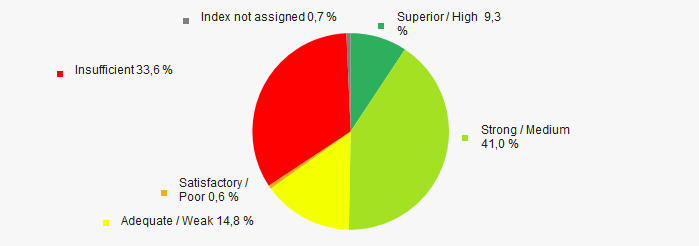 Picture 12. Distribution of TOP-1000 companies by solvency index Globas
Conclusion
Complex assessment of activity of the largest companies of the real economy sector of Samara, taking into account the main indexes, financial ratios and indicators, demonstrates the prevalence of negative trends in 2006 - 2011 (Table 1).
| Trends and evaluation factors | Relative share of factor, % | Possible forecast |
| Dynamics of the number of active companies |  10 10 |
|
| Rate of growth of the number of active companies |  -10 -10 |
During the acute phase of the crisis and the period of recovery, rate of growth of the number of active companies may be decreased |
| Dynamics of the average net assets value |  10 10 |
|
| Rate of growth (decline) in the average size of net assets |  -10 -10 |
During the acute phase of the crisis and the period of recovery, rate of growth in the net assets may be decreased |
| Increase / decrease in the share of enterprises with negative values of net assets |  10 10 |
|
| Dynamics of the average revenue |  10 10 |
|
| Rate of growth (decline) in the average size of revenue |  -10 -10 |
During the acute phase of the crisis, rate of growth in revenue may be decreased |
| Dynamics of the average profit |  10 10 |
During the acute phase of the crisis and the period of recovery, the average profit may be decreased |
| Rate of growth (decline) in the average size of profit |  -10 -10 |
During the acute phase of the crisis and the period of recovery, rate of growth in the average size of profit may be decreased |
| Growth / decline in average values of companies’ net profit |  10 10 |
During the acute phase of the crisis and the period of recovery, net profit may be increased |
| Growth / decline in average values of companies’ net loss |  10 10 |
|
| Increase / decrease in average values of current liquidity ratio |  5 5 |
|
| Increase / decrease in average values of return on investment ratio |  -10 -10 |
During the acute phase of the crisis and the period of recovery, return on investment ratio may by decreased |
| Increase / decrease in average values of asset turnover ratio, times |  -10 -10 |
During the acute phase of the crisis and the period of recovery, business activity may by decreased |
| Share of small and medium-sized businesses in terms of revenue being more than 20% |  -10 -10 |
|
| Financial position (the largest share) |  5 5 |
|
| Solvency index Globas (the largest share) |  5 5 |
|
| Average value of relative share of factors |  0,9 0,9 |
 positive trend (factor),
  negative trend (factor).
The largest companies of Russia
The economy of the Russian Federation is ranked the 6th in the world and the 2nd in Europe by the GDP volume (by the Purchasing Power Parity), and the 11th in the world and the 4th in Europe by the nominal GDP volume. Russia is among the leaders by mining and export of mineral resources; sales revenue forms the country’s budget. The experts of the Information Agency Credinform have made a research on the share of the fuel and energy complex in the TOP-30 of the largest companies, and on the validity of the opinion on insufficient diversification of the Russian economy.
| No. | Company | Net profit for 2019, billion RUB | Change to 2018 | Business activity |
| 1 | OIL COMPANY ROSNEFT |
6827,5 | -2,0% | Oil and gas |
| 2 | GAZPROM |
4758,7 | -8,1% | Oil and gas |
| 3 | RUSSIAN RAILWAYS |
1848,1 | +18,5% | Transportation |
| 4 | GAZPROM NEFT |
1809,8 | -12,6% | Oil and gas |
| 5 | SURGETNEFTEGAZ |
1555,6 | +2,0% | Oil and gas |
| 6 | MAGNIT |
1396,5 | +9,0% | Trade |
| 7 | AGROTORG |
1234,4 | +19,0% | Trade |
| 8 | GAZPROM MEZHREGIONGAZ |
1099,1 | -7,8% | Oil and gas |
| 9 | TRANSNEFT |
960,8 | +2,5% | Oil and gas |
| 10 | PEREKRESTOK |
906,7 | +3,2% | Trade |
| 11 | MMC NORILSK NICKEL |
878,1 | +44,2% | Metallurgy |
| 12 | LUKOIL WESTERN SIBERIA |
849,7 | -1,2% | Oil and gas |
| 13 | TATNEFT |
827,0 | +4,3% | Oil and gas |
| 14 | TC MEGAPOLIS |
744,9 | +6,1% | Trade |
| 15 | OIL COMPANY BASHNEFT |
703,1 | -6,9% | Oil and gas |
| 16 | GAZPROMNEFT-REGIONAL SALES |
617,9 | -6,7% | Oil and gas |
| 17 | AEROFLOT-RUSSIAN AIRLINES |
551,8 | +9,3% | Transportation |
| 18 | NOVATEK |
528,5 | -5,7% | Oil and gas |
| 19 | SAMOTLORNEFTEGAZ |
468,8 | +0,8% | Oil and gas |
| 20 | SIBUR HOLDING |
462,9 | -4,8% | Oil and gas |
| 21 | SEVERSTAL |
457,6 | +5,7% | Metallurgy |
| 22 | CONCERN ROSENERGOATOM |
456,7 | +17,0% | Electric power |
| 23 | LUKOIL-VOLGOGRADNEFTEPERERABOTKA |
456,4 | -0,9% | Oil and gas |
| 24 | LENTA |
445,0 | +1,4% | Trade |
| 25 | LUKOIL |
444,5 | +68,1% | Oil and gas |
| 26 | LUKOIL-KOMI |
442,4 | -5,1% | Oil and gas |
| 27 | MAGNITOGORSK IRON AND STEEL WORKS |
434,9 | -5,1% | Metallurgy |
| 28 | NOVOLIPETSK STEEL |
421,8 | -14,6% | Metallurgy |
| 29 | LUKOIL-PERMNEFTEORGSINTEZ |
390,8 | +0,7% | Oil and gas |
| 30 | VANKORNEFT |
383,3 | -9,9% | Oil and gas |
The analysis shows that companies of the fuel and energy complex dominate the TOP-30 with the share of 60%. Picture 1 presents distribution of the shares of the TOP-30 largest companies by the industries.
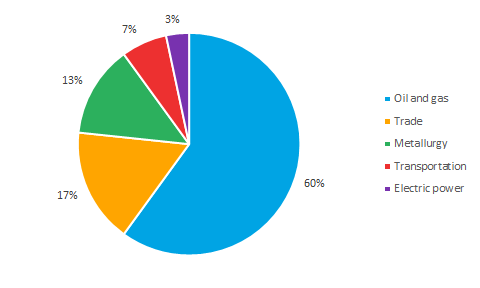 Picture 1. Distribution of companies by the industry
Following the results of the ranking, the oil and gas companies still have the leading positions. However, it does not mean that the Russian economy is not diversified enough. Russia is ranked the 2nd in the world by mining and export of crude oil and natural gas extraction, also it is the 1st by export of natural gas in the world. That is why so many companies of the fuel and energy complex are included in the TOP-30. The number of these companies will be much less in the TOP-100, for instance.