Trends in footwear manufacturing
Information agency Credinform has observed trends in the activity of the largest Russian footwear manufacturers.
Enterprises with the largest volume of annual revenue (TOP-10 and TOP-500), were selected for the analysis, according to the data from the Statistical Register for the latest available periods (for 2015-2017). The analysis was made on the basis of the data of the Information and Analytical system Globas.
Net assets - indicator, reflecting the real value of company's property, is calculated annually as the difference between assets on the enterprise balance and its debt obligations. The indicator of net assets is considered negative (insufficiency of property), if company’s debt exceeds the value of its property.
For ten years average amounts of net assets of TOP-500 companies have increasing tendency (Picture 1).
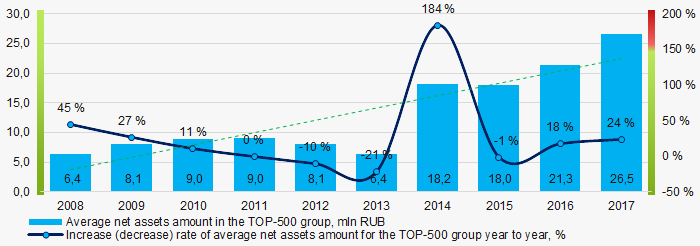 Picture 1. Change in TOP-500 average indicators of the net assets amount of footwear manufacturers in 2008 – 2017
Share of companies with insufficiency of property among TOP-500 for the last three years is relatively high and tends to decrease (Picture 2).
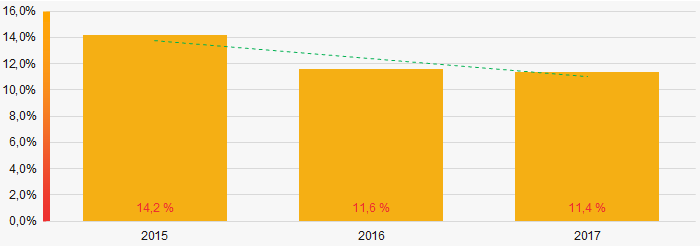 Picture 2. Share of companies with negative value of net assets amount in TOP-500 in 2015 – 2017
 Sales revenue
The revenue of 10 leaders of the industry made 45% of the total revenue of TOP-500 companies in 2017(Picture 3). It demonstrates high level of monopolization in the industry.
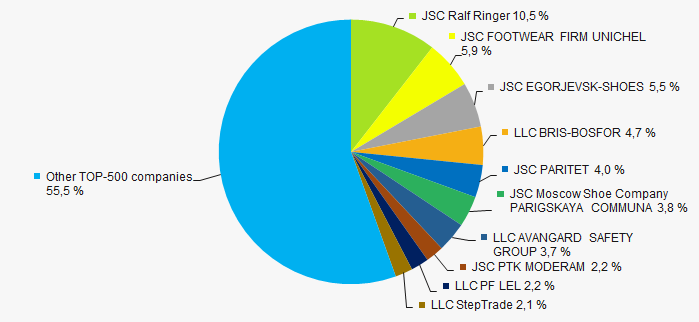 Picture 3. Shares of participation of TOP-10 companies in the total revenue of TOP-500 companies for 2017
In general, over a ten-year period an increase of indicators of average revenue volume is observed (Picture 4).
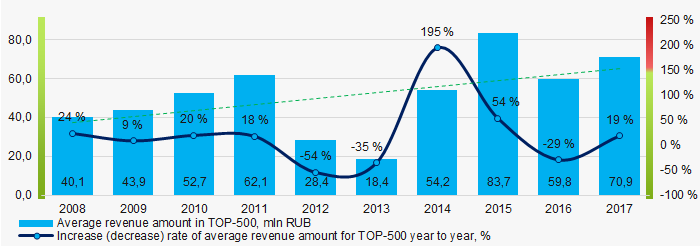 Picture 4. Change in the average revenue of footwear manufacturers in 2008 – 2017
 Profit and losses
For ten years average indicators of net profit have increasing tendency (Picture 5).
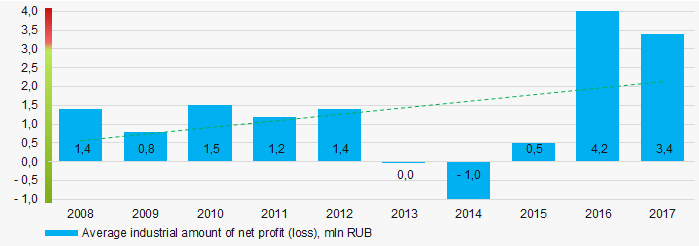 Picture 5. Change in the average values of net profit of footwear manufacturers in 2008 – 2017
 Over a three-year period, the average values of profit indicators of TOP-500 companies tend to increase. Besides, average value of net loss is decreasing (Picture 6).
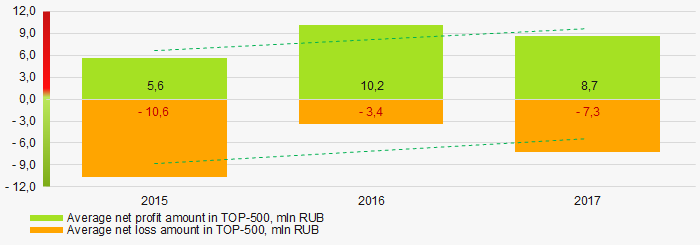 Picture 6. Change in the average indicators of profit and loss of TOP-500 companies in 2015 – 2017
 Key financial ratios
Over the ten-year period the average indicators of the current liquidity ratio were above the range of recommended values – from 1,0 up to 2,0 with increasing tendency (Picture 7).
The current liquidity ratio (the relation of the amount of current assets to short-term liabilities) shows the sufficiency of company’s funds for repayment of its short-term liabilities
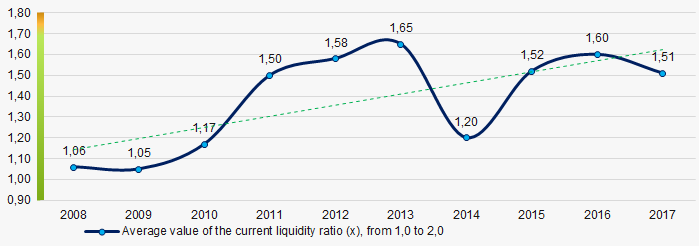 Picture 7. Change in the industry values of the current liquidity ratio of footwear manufacturers in 2008 – 2017
 Relatively high level of the average indicators of the return on investments ratio with decreasing tendency has been observed for ten years. (Picture 8).
The ratio is calculated as the relation of net profit to the sum of own capital and long-term liabilities and demonstrates the return on the equity involved in the commercial activity of own capital and the long-term borrowed funds of an organization.
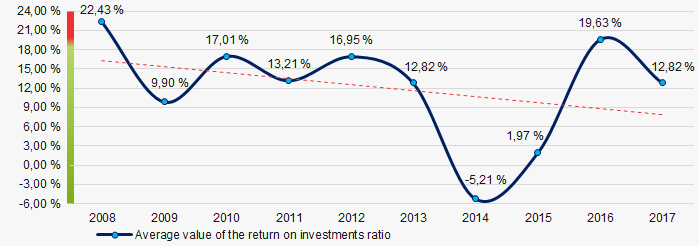 Picture 8. Change in the average values of the return on investments ratio of footwear manufacturers in 2008 – 2017
Asset turnover ratio is calculated as the relation of sales revenue to the average value of total assets for a period and characterizes the efficiency of use of all available resources, regardless of the sources of their attraction. The ratio shows how many times a year a complete cycle of production and circulation is made, yielding profit.
This business activity ratio showed a tendency to decrease for ten-year period (Picture 9).
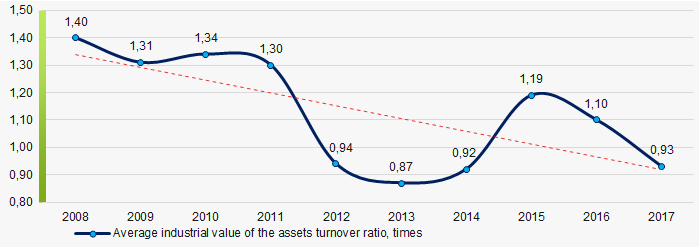 Picture 9. Change in the average values of the asset turnover ratio of footwear manufacturers in 2008 – 2017
 Small business
91% of TOP-500 companies are registered in the Register of small and medium enterprises of the Federal Tax Service of the RF. Besides, share of the companies in the total revenue of TOP-500 amounts to 46% in 2017, that significantly exceeds average indicator for the country (Picture 10).
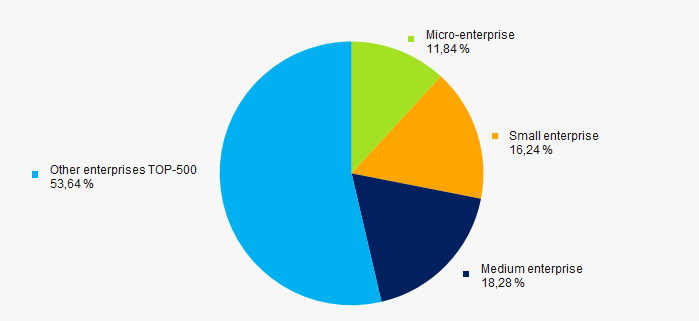 Picture 10. Shares of small and medium enterprises in TOP-500 companies, %
Main regions of activities
TOP-500 companies are unequally distributed on the territory of Russia and registered in 64 regions. The largest companies in terms of revenue volume are concentrated in Moscow and Moscow region (Picture 11).
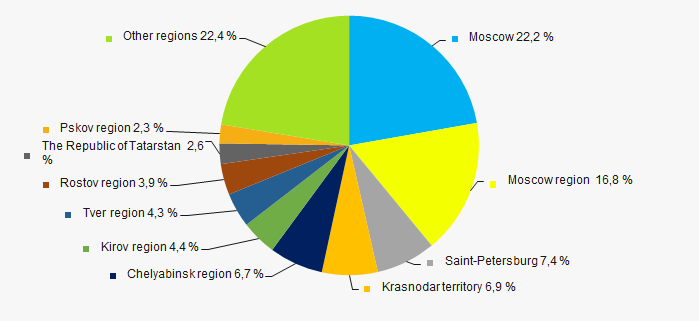 Picture 11. Distribution of revenue of TOP-500 companies by regions of Russia
 Financial position score
An assessment of the financial position of TOP-500 companies shows that major part of companies are in an average financial position (Picture 12).
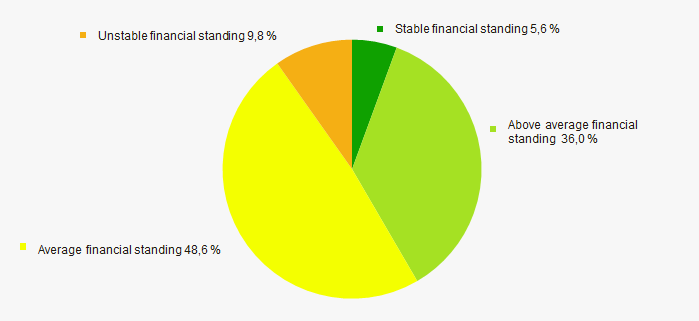 Picture 12. Distribution of TOP-500 companies by financial position score
Solvency index Globas
Most of TOP-500 companies have got from Medium to Superior Solvency index Globas, that points to their ability to repay their debts to the full extent (Picture 13).
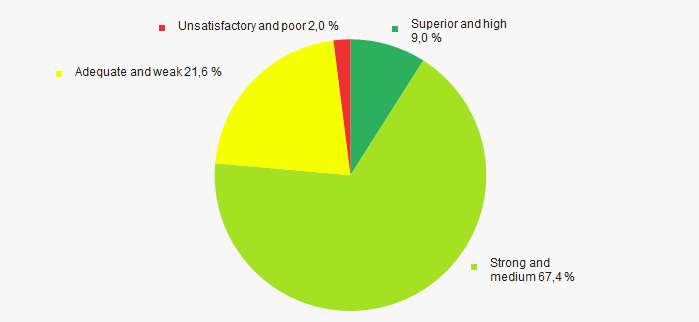 Picture 13. Distribution of TOP-500 companies by solvency index Globas
Industrial production index
According to the data from the Federal State Statistics Service, during 2018 – 2019 increasing tendency for the industrial production index of manufacture of footwear is observed (Picture 14).
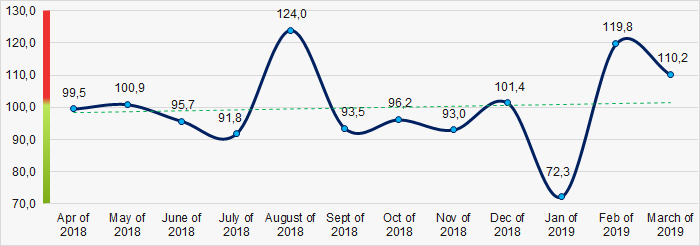 Picture 14. Industrial production index of manufacture of footwear in 2018 – 2019, (%)
According to the same data, share of footwear manufacturers in the total revenue volume from sale of goods, products, works and services for the country was 0,02% in 2018.
Conclusion
Comprehensive assessment of the activity of largest footwear manufacturers, taking into account the main indexes, financial indicators and ratios, demonstrates the presence of favorable trends (Table 1).
| Trends and assessment factors | Share of factor, % |
| Rate of increase (decrease) of average amount of net assets |  10 10 |
| Increase / decrease of share of companies with negative values of net assets |  5 5 |
| Increase (decrease) rate of average revenue amount |  10 10 |
| Rate of competition / monopolization |  -10 -10 |
| Increase (decrease) rate of average net profit (loss) amount |  10 10 |
| Increase / decrease of average net profit amount of TOP-1000 companies |  10 10 |
| Increase / decrease of average net loss amount of TOP-1000 companies |  10 10 |
| Increase / decrease of average industrial values of the current liquidity ratio |  10 10 |
| Increase / decrease of average industrial values of the return on investments ratio |  -5 -5 |
| Increase / decrease of average industrial values of the assets turnover ratio, times |  -10 -10 |
| Share of small and medium enterprises in the industry in terms of revenue volume more than 22% |  10 10 |
| Regional concentration |  -10 -10 |
| Financial position (major share) |  5 5 |
| Solvency index Globas (major share) |  10 10 |
| Industrial production index |  5 5 |
| Average value of factors |  4,0 4,0 |
 — positive trend (factor),
  — negative trend (factor).
Tax code changes
The significant changes in the Russian Tax Code were made in accordance with the Federal Law №63-FZ as of April 15, 2019.
The amendments improve the procedure of income and property tax collection, granting benefits on transport and land taxes as well as simplify fiscal management, reduce tax return and the administrative burden on taxpayers.
In particular, since January 1, 2020 mandatory declarations on transport and land taxes will be canceled. Tax authorities will inform entities, which have vehicles and land plots, about the charged taxes. The Tax service gets such information automatically from registration authorities. Notifications must be sent no later than 6 months after the due date for tax payment. In case of difference between the tax amount and actually paid taxes, entities may submit the explanations and relevant documents within 10 days after receiving such notifications. After the consideration of explanations, the tax authorities may update the notifications within a month or will require to pay taxes.
The mandatory settlements of advance payments on property tax are cancelled. Besides, the entities are given the right to choose the authority, in which they can submit the unified tax return, in case the entity has multiple objects in the same region.
In addition, a VAT deduction is provided for the "export" of services and works. In case Russia is not recognized as the place of sale of works or services, "input" VAT can be deducted.
The transfer of property on a free-of-charge basis to the ownership of the Russian Federation for the purposes of organization or for scientific research in Antarctica is also exempt from VAT payment.
The property transferred to the treasury of the region, municipality or to the ownership of the Russian Federation is not the subject to VAT.
Provisions regarding the investment tax deduction on income tax were clarified. This refers to deductions for expenditure on infrastructure.
Since 2020, individual entrepreneurs will not be obligated to submit a preliminary declaration 4-NDFL (personal income tax). Instead of it, there will be advance payments on the basis of the actual income. The Federal law came into force on April 15, 2019, with the exception of some provisions that will come into force on other dates.