Trends in Kazan economy in time of crisis
Information agency Credinform has prepared a review of activity trends of the largest companies of Kazan real economy sector during the financial crisis of 2008-2009.
The largest companies (ТОP-1000) in terms of annual revenue were selected according to the data from the Statistical Register for the latest available periods (2006 - 2011). The analysis was based on data of the Information and Analytical system Globas.
Number of active companies
Within 2006 - 2011 the number of active companies was growing, however during the acute phase of crisis, the growth rate was decreasing.
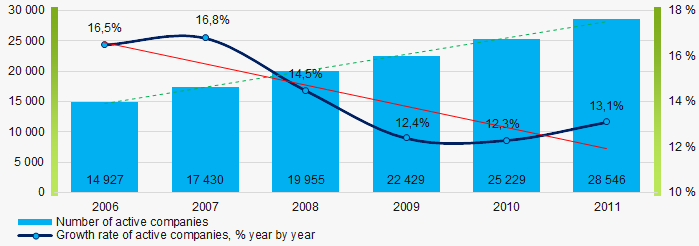 Picture 1. Dynamics of active companies in 2006 – 2011
 Net assets is a ratio reflecting the real value of company's property. It is calculated annually as the difference between assets on the enterprise balance and its debt obligations. The ratio is considered negative (insufficiency of property), if company’s debt exceeds the value of its property.
he largest company in terms of net assets was JSC SVYAZYINVESTNEFTEKHIM, INN 1655070635 In 2011 net assets of the company amounted to 197 billion RUB. In 2019, the indicator amounted to 683 billion RUB.
The smallest size of net assets in TOP-1000 had JSC KAZSTROIINVEST, INN 1660054950. The lack of property of the company in 2011 was expressed in negative terms -672 million RUB and – 6,7 billion RUB in 2019.
Within 2006-2011, the average values of TOP-1000 net assets showed the growing tendency, however the growth rate was decreasing, especially in the beginning of recovery. (Picture 2).
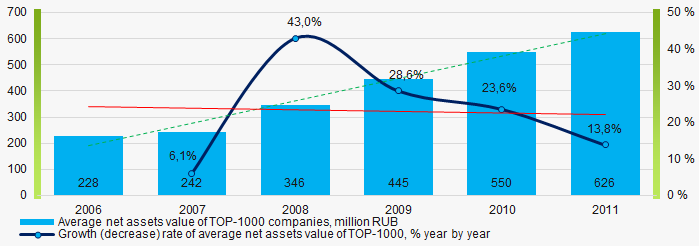 Picture 2. Change in average net assets value of ТОP-1000 companies in 2006– 2011
In general, within 2006 - 2011, the share of ТОP-1000 enterprises with lack of property was decreasing (Picture 3).
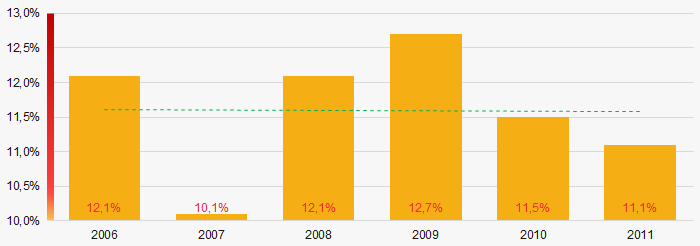 Picture 3. The share of enterprises with negative net assets value in ТОP-1000 in 2006 – 2011
 Sales revenue
The largest company by sales revenue was PUBLIC STOCK COMPANY TAIF, INN 1655020761. In 2011, the indicator amounted to almost 78 billion RUB and 160 billion RUB in 2019.
In general, the growing trend in sales revenue with increasing growth rate was observed (Picture 4).
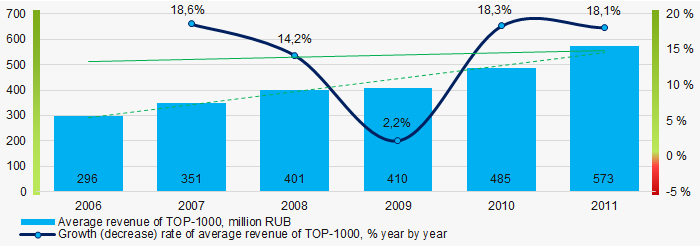 Picture 4. Change in average revenue of TOP-1000 in 2006 – 2011
Profit and loss
The largest company in terms of net profit was also JSC SVYAZYINVESTNEFTEKHIM, INN 1655070635. In 2011, the company’s profit amounted to more than 11 billion RUB and 59 billion RUB in 2019.
Within 2006 – 2011, the average profit values of TOP-1000 showed the growing tendency with loss during the acute phase of crisis (Picture 5).
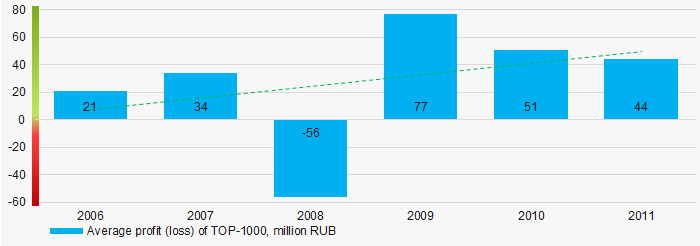 Picture 5. Change in average profit (loss) of TOP-1000 in 2006 – 2011
 In 2006 – 2011, the average net profit values of ТОP-1000 showed the growing tendency, along with this the average net loss was decreasing, especially during the acute phase of crisis (Picture 6).
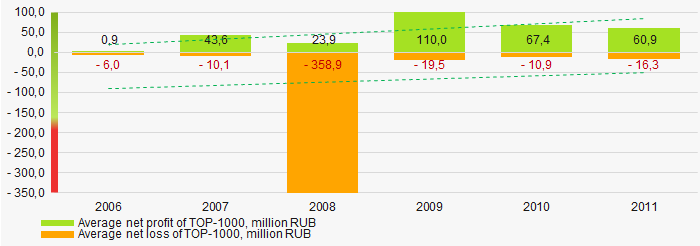 Picture 6. Change in average net profit/loss of ТОP-1000 in 2006 – 2011
Main financial ratios
In 2006 – 2011 the average values of the current liquidity ratio were higher than the recommended values - from 1,0 to 2,0, with growing trend (Picture 7).
The current liquidity ratio (ratio of total working capital to short-term liabilities) shows the sufficiency of company’s assets to meet short-term obligations.
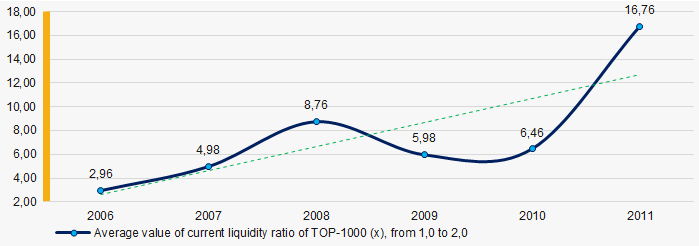 Picture 7. Change in average values of current liquidity ratio of TOP-1000 companies in 2006 – 2011
 Within 2006 - 2011 the decreasing trend of the average values of ROI ratio with significant downward trend in 2009 was observed (Picture 8).
The ROI ratio is calculated as a ratio of net profit to sum of stockholder equity and long-term liabilities and shows the return from equity involved in commercial activities and long-term borrowed funds.
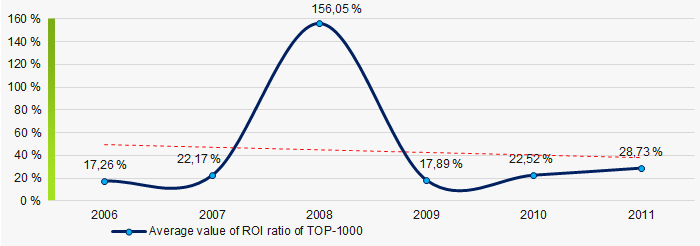 Picture 8. Change in average values of ROI ratio in 2006 – 2011
 Assets turnover ratio is the ratio of sales revenue and company’s average total assets for a period. It characterizes the effectiveness of using of all available resources, regardless the source of their attraction. The ratio shows how many times per year the full cycle of production and circulation is performed, generating the corresponding effect in the form of profit.
In 2006 – 2011, this business activity ratio demonstrated the decreasing trend, especially during the recovery (Picture 9).
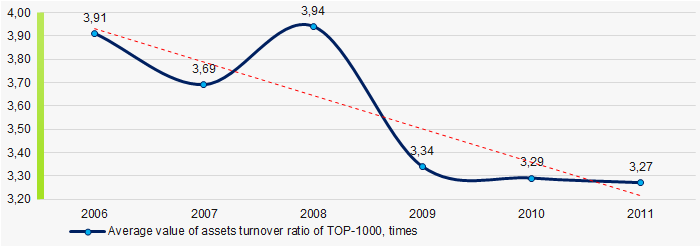 Picture 9. Change in average values of assets turnover ratio of TOP-1000 companies in 2006 – 2011
Small businesses
70% of ТОP-1000 companies are registered in the Unified register of small and medium-sized enterprises of the Russian Federal Tax Service. Herein, in 2011 their share in TOP-1000 total revenue amounted to 12% (Picture 10).
 Picture 10. Revenue of small and medium-sized enterprises in 2011
 Financial position score
An assessment of the financial position of TOP-1000 companies shows that in 2020 the largest part has the average financial position (Picture 11).
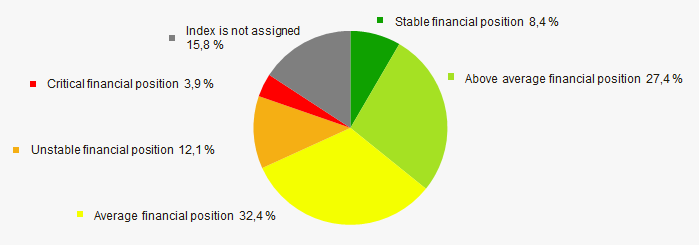 Picture 11. Distribution of TOP-1000 companies by financial position score in 2020
 Solvency index Globas
In 2020 the most of TOP-1000 companies got superior/high or strong/medium Solvency index Globas, this fact shows the ability of the companies to meet their obligations in time and fully (Picture 12).
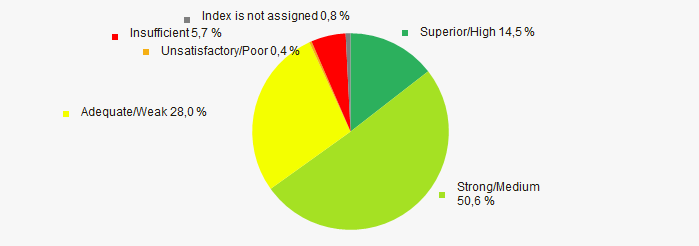 Picture 12. Distribution of TOP-1000 companies by Solvency index Globas in 2020
 Conclusion
A complex assessment of activity of the largest Russian companies of Kazan real economy sector, taking into account the main indexes, financial ratios and indicators, demonstrates the presence of positive trends within 2006-2011 (Table 1).
| Trends and assessment factors | Relative share, % | Possible forecast |
| Dynamics of active companies |  10 10 |
|
| Growth rate of active companies |  -10 -10 |
During the acute phase of crisis, the number of active companies may decrease |
| Dynamics of average net assets value |  10 10 |
|
| Growth/drawdown rate of average net assets value |  -10 -10 |
During the acute phase of crisis, the growth rate of average net assets may decrease |
| Increase / decrease in the share of enterprises with negative net assets |  10 10 |
|
| Dynamics of average revenue |  10 10 |
|
| Growth/drawdown rate of average revenue |  10 10 |
During the acute phase of crisis, the growth rate of revenue may decrease |
| Dynamics of average profit |  10 10 |
During the acute phase of crisis, the average profit may decrease |
| Increase / decrease in average net profit of companies |  10 10 |
During the acute phase of crisis, the net profit may decrease |
| Increase / decrease in average net loss of companies |  -10 -10 |
During the acute phase of crisis, the net loss may increase |
| Increase / decrease in average values of current liquidity ratio |  5 5 |
|
| Increase / decrease in average values of ROI ratio |  -10 -10 |
During the recovery, the ROI ratio may decrease |
| Increase / decrease in average values of assets turnover ratio, times |  -10 -10 |
In time of crisis, the business activity may decrease |
| Share of small and medium-sized businesses by revenue more than 20% |  -10 -10 |
|
| Financial position (the largest share) |  5 5 |
|
| Solvency index Globas (the largest share) |  10 10 |
|
| Average value of factors |  1,9 1,9 |
 favorable trend (factor),
  unfavorable trend (factor).
Top-20 world economies: the GDP dynamics for the I-II quarter 2020
The pandemic COVID-19 and restrictions related to it have significantly hit the world largest economies. Current data on the GDP dynamics for the I-II quarter 2020 gives evidence to different level of drop and time required for the recovery to the lost positions.
China became the first country to face the strict lockdown. It lead to a drop in the GDP in the I quarter 2020 by - 6,8% to the same period of the previous year. The indicator became the worst since 1976. However, in the II quarter 2020 the economy resumed the growth. Thus, the negative effects of the restrictions in the Celestial Empire might be overcome by the end of 2020.
The USA is just entering the crisis: after the nominal growth in the I quarter 2020, the GDP in the II quarter has fell by -9,5% at once to the II quarter 2019 – the largest quarter drop ever in the history of monitoring since 1948.
Western Europe bears the biggest losses. It has come across the largest crisis after the end of the Second World War. The year on year GDP in Spain in the II quarter 2020 reduced by -22,1%, in United Kingdom by -21,7%, in France by -19%, in Italy by -17,3%, in Germany by -11,3%. It will take several years to get back to the pre-pandemic level. Another economic shutdown will drive back the EU development on several decades, in case of the second wave of the pandemic.
Russia has suffered in a smaller extent: in the I quarter 2020 the growth by 1,6%, was noted, in the II quarter 2020 - the decline by -8,5%.
It’s revealing that countries with the high industry share in the GDP have suffered less from the crisis than those where the services sector is dominant. Read about this in our previous publication.
| Rank | Country | GDP (PPP), USD trillion, 2019 | GDP dynamics, I quarter 2020 to I quarter 2019, % | GDP dynamics, II quarter 2020 to II quarter 2019, % |
| 1 | China | 27 307 | -6,8 | 3,2 |
| 2 | USA | 21 428 | 0,3 | -9,1 |
| 3 | India | 11 043 | 3,1 | no data |
| 4 | Japan | 5 712 | -1,7 | -9,9 |
| 5 | Germany | 4 444 | -2,3 | -11,3 |
| 6 | Russia | 4 390 | 1,6 | -8,5 |
| 7 | Indonesia | 3 736 | 3,0 | -5,3 |
| 8 | Brasilia | 3 481 | -0,3 | no data |
| 9 | United Kingdom | 3 162 | -1,7 | -21,7 |
| 10 | France | 3 062 | -5,0 | -18,9 |
| 11 | Mexico | 2 616 | -1,4 | -18,7 |
| 12 | Italy | 2 455 | -5,4 | -17,3 |
| 13 | Turkey | 2 362 | 4,5 | no data |
| 14 | Republic of Korea | 2 320 | 1,4 | -2,9 |
| 15 | Spain | 1 924 | -4,1 | -22,1 |
| 16 | Canada | 1 904 | -0,9 | -13,0 |
| 17 | Saudi Arabia | 1 901 | -1,0 | no data |
| 18 | Iran | 1 491 | no data | no data |
| 19 | Egypt | 1 391 | 5,0 | no data |
| 20 | Thailand | 1 378 | -1,8 | -12,2 |
Source: IMF, EUROSTAT,OECD, public sources, Credinform calculations
With the multidirectional regional GDP dynamics, the competition in the world will strengthen: the most affected countries will have to protect their companies and markets with the highest possible range of protectionist measures. On the other hand, the new possibilities are opened for the changes of the global production and sale.