
Order a report
Custom-made industry research, company ratings, competitor analysis


Software development trends
Information agency Credinform has prepared a review of the activity trends of the largest software developers in Russia.
Software developers and companies rendering consultancy services in this business area (TOP-1000) with the largest annual revenue were selected for the analysis, according to the latest accounting periods in the Statistical Register and the Federal Tax Service (2010 – 2019). The analysis was based on the data from the Information and Analytical system Globas.
Net assets value is an indicator, reflecting the real value of company’s property, is calculated annually as the difference between assets on the enterprise balance and its debt obligations. The indicator of net assets is considered negative (insufficiency of property), if company’s debt exceeds the value of its property.
The largest enterprise of the industry in terms of net assets is Joint Stock Company Atomic Energy Power Corporation, INN 7706664260, Moscow. In 2019, net assets value of the company amounted to 1352 billion RUB.
The lowest net assets value among TOP-1000 was recorded for TECHNOSERV MANAGEMENT, INN 7722536788, Moscow. In 2019, insufficiency of property of the company was indicated in negative value of -5142 billion RUB.
During the decade, average industry values of net profit ratio had a tendency to decrease with a positive dynamics of growth rates. (Picture 1).
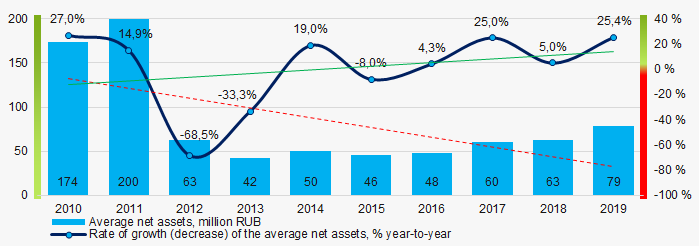 Picture 1. Change of industry average values of net profit ratio of software developers in Russia in 2010 – 2019
The shares of TOP-1000 enterprises with insufficiency of assets have a tendency to decrease in the last five years (Picture 2).
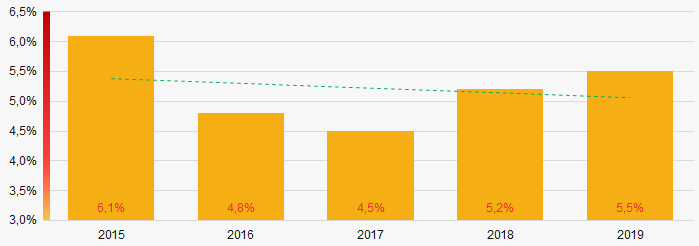 Picture 2. Shares of companies with negative net assets value of TOP-1000 in 2015 – 2019
Sales revenue
The revenue volume of 10 leading companies of the industry made 31% of the total revenue of TOP-1000 in 2019 (Picture 3). It points to a high level of monopolization in the industry.
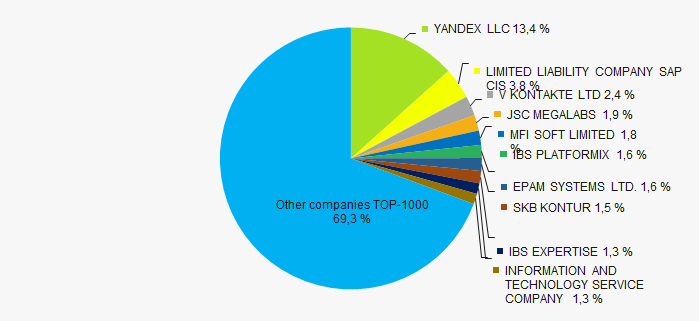 Picture 3. Shares of participation of TOP-10 companies in the total revenue of TOP-1000 enterprises in 2019
In general, there is a tendency to decrease in the revenue volumes, with a positive dynamics of growth rates (Picture 4).
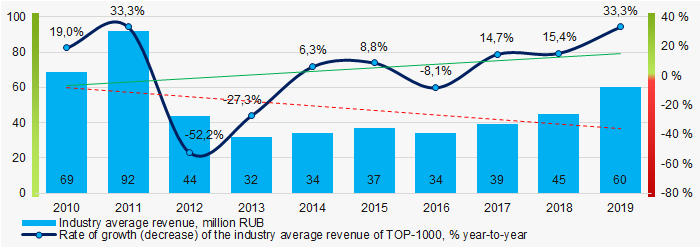 Picture 4. Change in the industry average revenue in 2010 – 2019
Profit and losses
The largest company of the industry in terms of net profit value is YANDEX LLC, INN 7736207543, Moscow. The company's profit amounted to 26,5 billion RUB in 2019.
Over a ten-year period, the indicators of the industry average profit have a tendency to decrease, with a positive dynamics of growth rates (Picture 5).
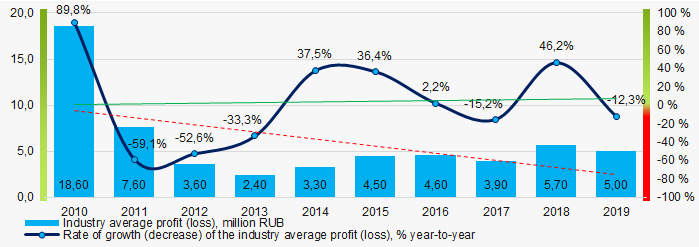 Picture 5. Change in the industry average indicators of profit (loss) in 2010 – 2019
Over a five-year period, average values of net profit’s indicators of TOP-1000 enterprises have a tendency to decrease, at the same time the average value of net loss increases. (Picture 6).
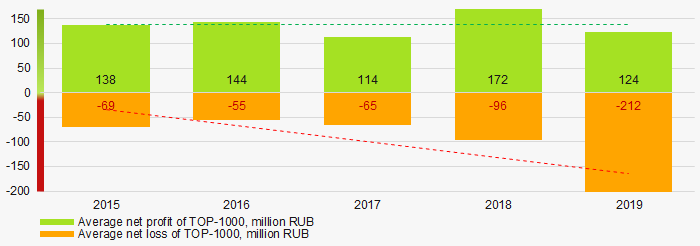 Picture 6. Change in the industry average indicators of net profit and net loss of TOP-1000 companies in 2015 – 2019
Key financial ratios
Over the ten-year, period the industry average indicators of the total liquidity were within the range of recommended values - from 1,0 up to 2,0, with a tendency to increase. (Picture 7).
The total liquidity ratio (the relation of the amount of current assets to short-term liabilities) shows the sufficiency of company’s funds for repayment of its short-term liabilities.
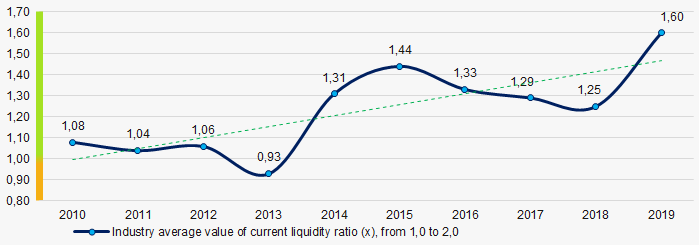 Picture 7. Change in the industry average values of the total liquidity ratio in 2010 – 2019
Over the ten-year period, the industry average values of the return on investment ratio have a tendency to increase. (Picture 8).
The ratio is calculated as the relation of net profit to the sum of own capital and long-term liabilities and demonstrates the return on the equity involved in the commercial activity and the long-term borrowed funds of an organization.
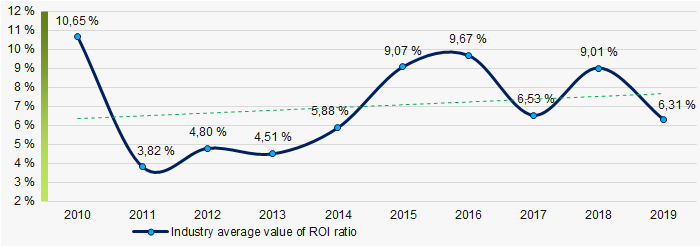 Picture 8. Change in industry average values of ROI ratio of TOP-1000 in 2010 – 2019
Asset turnover ratio is calculated as the relation of sales revenue to the average value of total assets for a period and characterizes the efficiency of use of all available resources, regardless of the sources of their attraction. The ratio shows how many times a year a complete cycle of production and circulation is performed, generating the corresponding effect in the form of profit.
Over a ten-year period, indicators of this ratio of business activity showed an upward trend (Picture 9).
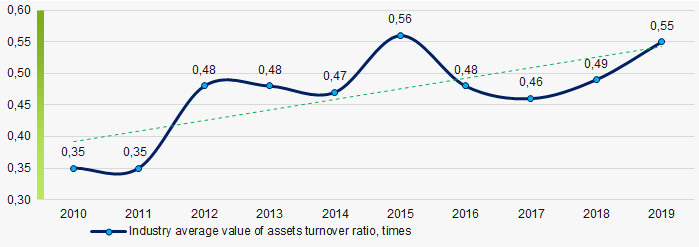 Picture 9. Change in average values of assets turnover ratio of TOP-1000 in 2010 – 2019
Small enterprises
66% companies of TOP-1000 are registered in the Register of small and medium-sized enterprises of the Federal Tax Service of the Russian Federation. At the same time, their share in total revenue of TOP-1000 amounts to 19%, which is lower than the national average indicator in 2018-2019 (Picture 10).
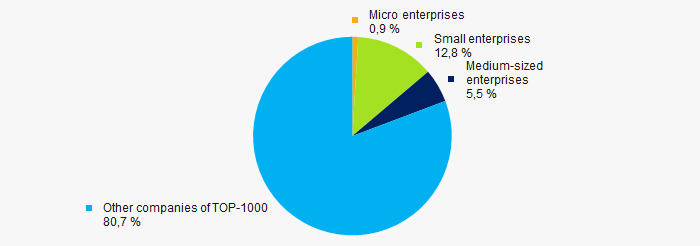 Picture 10. Shares of the revenue of small and medium-sized enterprises in TOP-1000 companies
Main regions of activity
The TOP-1000 companies are registered in 55 regions and distributed unequal across Russia. Almost 83% of the largest enterprises in terms of revenue are concentrated in Moscow and St. Petersburg (Picture 11).
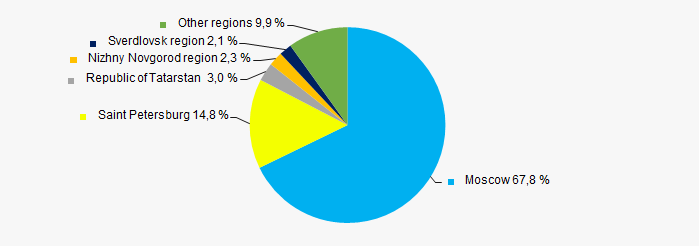 Picture 11. Distribution of the revenue of TOP-1000 companies by Russian regions
Financial position score
According to the assessment, the financial position of most of TOP-1000 companies is above average (Picture 12).
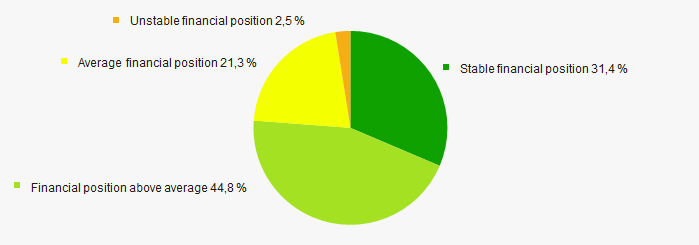 Picture 12. Distribution of TOP-1000 companies by financial position score
 Solvency index Globas
Most of TOP-1000 companies got Superior / High and Strong index Globas. This fact shows their ability to meet their obligations fully and by the due date (Picture 13).
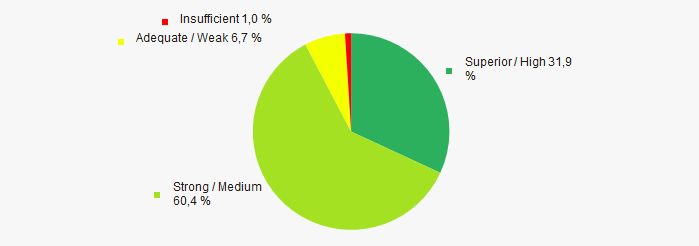 Picture 13. Distribution of TOP-1000 companies by solvency index Globas
Conclusion
Complex assessment of activity of the largest software developers in Russia, taking into account the main indexes, financial ratios and indicators, demonstrates the prevalence of positive trends in 2010- 2019 (Table 1).
| Trends and evaluation factors | Specific share of factor, % |
| Dynamics of the number of active companies | |
| Rate of growth (decline) in the average size of net assets | |
| Increase / decrease in the share of enterprises with negative values of net assets | |
| Level of competition / monopolization | |
| Dynamics of the average revenue | |
| Rate of growth (decline) in the average size of revenue | |
| Dynamics of the average profit (loss) | |
| Rate of growth (decline) in the average size of profit (loss) | |
| Increase / decrease in average values of companies’ net profit | |
| Increase / decrease in average values of companies’ net loss | |
| Increase / decrease in average values of total liquidity ratio | |
| Increase / decrease in average values of return on investment ratio | |
| Increase / decrease in average values of asset turnover ratio, times | |
| Share of small and medium-sized businesses in terms of revenue being more than 20% | |
| Regional concentration | |
| Financial position (the largest share) | |
| Solvency index Globas (the largest share) | |
| Average value of relative share of factors | |
![]() positive trend (factor),
positive trend (factor), ![]() negative trend (factor).
negative trend (factor).