Information agency Credinform has prepared a ranking of the largest Russian companies of the real economy sector. The largest enterprises (TOP-10) founded before 2000 in terms of annual revenue were selected according to the data from the Statistical Register and the Federal Tax Service for the available periods (2017-2019). Then the companies were ranged by solvency ratio (Table 1). The analysis was based on the data from the Information and Analytical system Globas.
Solvency ratio (х) is calculated as a ratio of equity capital to total balance. The ratio shows the company’s dependence from external borrowings. The recommended value of the ratio is >0,5.
The ratio lower than recommended value signifies about strong dependence from external sources of funds; such dependence may lead to liquidity crisis, unstable financial position in case of contraction in business conditions.
For the most full and fair opinion about the company’s financial position the whole set of financial indicators and ratios should be taken into account.
Name, INN, region | Revenue, billion RUB | Net profit (loss), billion RUB. | Solvency ratio (x), >0,5 | Solvency index Globas | |||
2018 | 2019 | 2018 | 2019 | 2018 | 2019 | ||
1 | 2 | 3 | 4 | 5 | 6 | 7 | 8 |
JSC SURGUTNEFTEGAS INN 8602060555 Khanty-Mansiysk Autonomous Region - Yugra |
![]() |
![]() |
![]() |
![]() |
![]() |
![]() |
173 Superior |
LLC GAZPROM MEZHREGIONGAZ INN 5003021311 St.Petersburg |
![]() |
![]() |
![]() |
![]() |
![]() |
![]() |
266 Medium |
JSC GAZPROM INN 7736050003 Moscow |
![]() |
![]() |
![]() |
![]() |
![]() |
![]() |
174 Superior |
JSC TRADE HOUSE PEREKRESTOK INN 7728029110 Moscow |
![]() |
![]() |
![]() |
![]() |
![]() |
![]() |
234 Strong |
LLC AGROTORG INN 7825706086 St.Petersburg |
![]() |
![]() |
![]() |
![]() |
![]() |
![]() |
238 Strong |
JSC Mining and Metallurgical Company NORILSK NICKEL INN 8401005730 Krasnoyarsk region |
![]() |
![]() |
![]() |
![]() |
![]() |
![]() |
177 High |
JSC Tander INN 2310031475 Krasnodar region |
![]() |
![]() |
![]() |
![]() |
![]() |
![]() |
240 Strong |
JSC Gazprom Neft INN 5504036333 St.Petersburg |
![]() |
![]() |
![]() |
![]() |
![]() |
![]() |
188 High |
JSC ROSNEFT OIL COMPANY INN 7706107510 Moscow |
![]() |
![]() |
![]() |
![]() |
![]() |
![]() |
197 High |
Oil Transporting JSC Transneft INN 7706061801 Moscow |
![]() |
![]() |
![]() |
![]() |
![]() |
![]() |
157 Superior |
Average value for TOP-10 companies | ![]() |
![]() |
![]() |
![]() |
![]() |
![]() |
|
Average value for TOP-10000 companies | ![]() |
![]() |
![]() |
![]() |
![]() |
![]() |
growth of indicator in comparison with prior period,
decline of indicator in comparison with prior period
The average value of solvency ratio for TOP-10 companies is lower than average ТОP-1000 value. In 2019, three companies show ratio above the recommended value and eight of them improved the result.
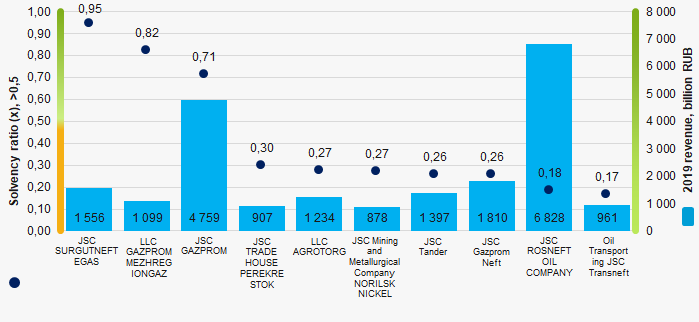
Within 6 years, the TOP-1000 average indicators of solvency ratio are below the recommended value with a growing tendency (Picture 2).
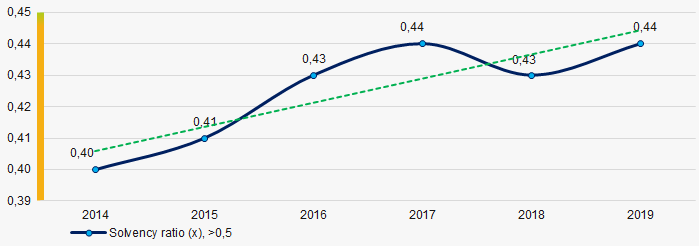
Information agency Credinform has prepared a review of activity trends of the oldest companies of the real economy sector.
The largest companies (ТОP-1000) founded before 2000 in terms of annual revenue were selected according to the data from the Statistical Register and the Federal Tax Service for the latest available periods (2014 - 2019). The analysis was based on data of the Information and Analytical system Globas.
Net assets is a ratio reflecting the real value of company's property. It is calculated annually as the difference between assets on the enterprise balance and its debt obligations. The ratio is considered negative (insufficiency of property), if company’s debt exceeds the value of its property.
The largest company in terms of net assets is JSC GAZPROM, INN 7736050003, Moscow. In 2019 net assets of the company amounted to more than 11 335 billion RUB.
The smallest size of net assets in TOP-1000 had JSC UTAIR AVIATION, INN 7204002873, Khanty-Mansiysk Autonomous Region - Yugra. The lack of property of the company in 2019 was expressed in negative terms -29,9 billion RUB.
For the last six years, the average values of TOP-1000 net assets showed the growing tendency with negative dynamics of growth rates (Picture 1).
For the last six years, the share of ТОP-1000 enterprises with lack of property is decreasing (Picture 2).
Sales revenue
In 2019, the total revenue of the 10 largest companies amounted to 34% from ТОP-1000 total revenue (Picture 3). This fact testifies the high level of capital concentration.
In general, the growing trend in sales revenue with positive dynamics of growth rates is observed (Picture 4).
Profit and loss
The largest company in terms of net profit is also JSC GAZPROM, INN 7736050003, Moscow. In 2019, the company’s profit amounted to 651 billion RUB.
For the last six years, the average profit values of TOP-1000 show the growing tendency with negative dynamics of growth rates (Picture 5).
Over a six-year period, the average net profit values of ТОP-1000 show the growing tendency, along with this the average net loss is decreasing (Picture 6).
Main financial ratios
For the last six years, the average values of the current liquidity ratio were higher than the recommended values - from 1,0 to 2,0, with growing trend (Picture 7).
The current liquidity ratio (ratio of total working capital to short-term liabilities) shows the sufficiency of company’s assets to meet short-term obligations.
Within six years, the decreasing trend of the average values of ROI ratio is observed (Picture 8).
The ROI ratio is calculated as a ratio of net profit to sum of stockholder equity and long-term liabilities and shows the return from equity involved in commercial activities and long-term borrowed funds.
Assets turnover ratio is the ratio of sales revenue and company’s average total assets for a period. It characterizes the effectiveness of using of all available resources, regardless the source of their attraction. The ratio shows how many times per year the full cycle of production and circulation is performed, generating the corresponding effect in the form of profit.
For the last six years, this business activity ratio demonstrated the decreasing trend (Picture 9).
Small businesses
Only 0,3% of ТОP-1000 companies are registered in the Unified register of small and medium-sized enterprises of the Russian Federal Tax Service. Herein, their share in TOP-1000 total revenue is only 0,1%, which is significantly lower than the national average value in 2018 – 2019 (Picture 10).
Main regions of activity
TOP-1000 companies are registered in 75 regions of Russia and are unequally located across the country. More than 47% of the largest enterprises in terms of revenue are located in Moscow and St. Petersburg (Picture 11).
Financial position score
An assessment of the financial position of TOP-1000 companies shows that more than a half of the companies has above average financial position (Picture 12).
Solvency index Globas
Most of TOP-1000 companies got superior/high or strong/medium Solvency index Globas, this fact shows the ability of the companies to meet their obligations in time and fully (Picture 13).
Conclusion
A complex assessment of activity of the oldest companies, taking into account the main indexes, financial ratios and indicators, demonstrates the presence of positive trends within 2014-2019 (Table 1).
Trends and assessment factors | Relative share, % |
Dynamics of average net assets value | ![]() |
Growth/drawdown rate of average net assets value | ![]() |
Increase / decrease in the share of enterprises with negative net assets | ![]() |
The level of capital concentration | ![]() |
Dynamics of average revenue | ![]() |
Growth/drawdown rate of average profit | ![]() |
Dynamics of average profit (loss) | ![]() |
Growth/drawdown rate of average revenue (loss) | ![]() |
Increase / decrease in average net profit of companies | ![]() |
Increase / decrease in average net loss of companies | ![]() |
Increase / decrease in average values of current liquidity ratio | ![]() |
Increase / decrease in average values of ROI ratio | ![]() |
Increase / decrease in average values of assets turnover ratio, times | ![]() |
Share of small and medium-sized businesses by revenue more than 22% | ![]() |
Regional concentration | ![]() |
Financial position (the largest share) | ![]() |
Solvency index Globas (the largest share) | ![]() |
Average value of factors | ![]() |
favorable trend (factor),
unfavorable trend (factor)